Research · Publication & note
Thermal Emission of Silicon at Near-Infrared Frequencies Mediated by Mie Resonances - Notes
Journal article
Published abstract
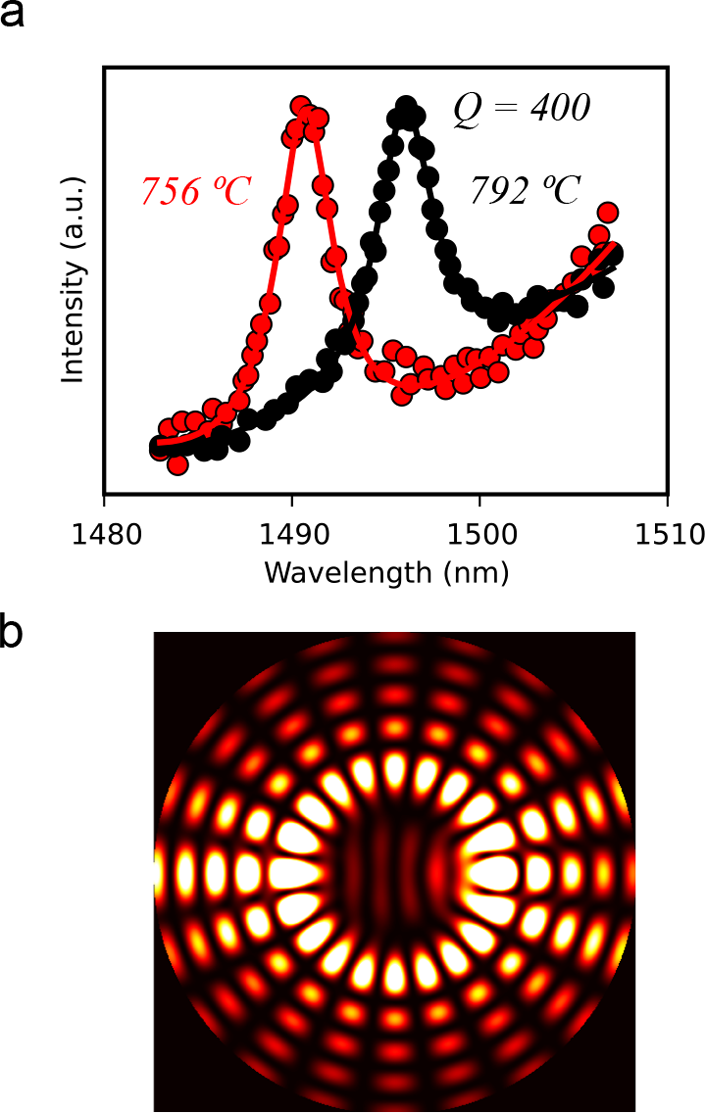
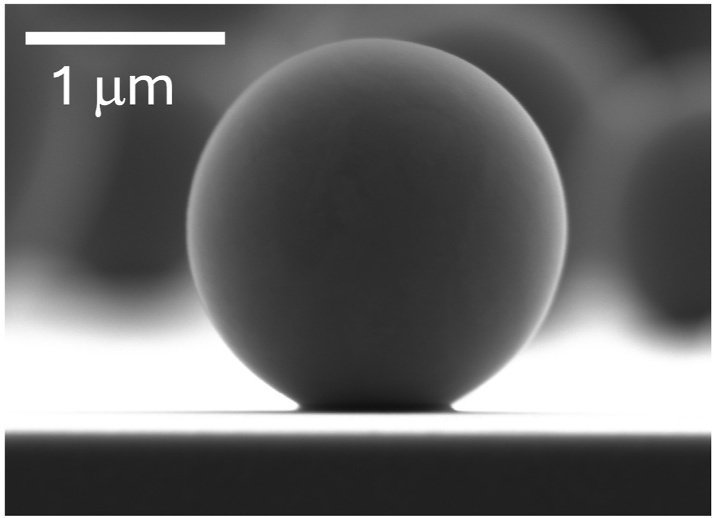
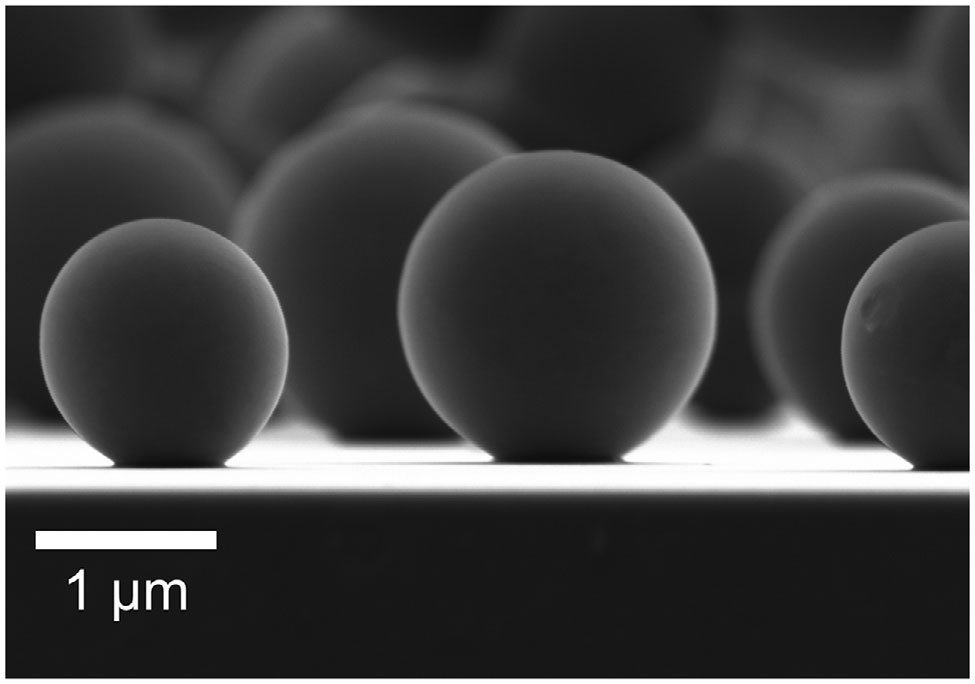
Planck’s law constitutes one of the cornerstones in physics. It explains the well-known spectrum of an ideal blackbody consisting of a smooth curve, whose peak wavelength and intensity depend on the temperature of the body. This scenario changes drastically, however, when the size of the emitting object is comparable to the wavelength of the emitted radiation. Here we show that a silicon microsphere (2-3 μm in diameter) heated to around 800 °C yields a thermal emission spectrum consisting of pronounced peaks that are associated with Mie resonances. We experimentally demonstrate in the near-infrared the existence of modes with an ultrahigh quality factor, Q, of 400, which is substantially higher than values reported so far, and set a new benchmark in the field of thermal emission. Simulations predict that the thermal response of the microspheres is very fast, about 15 μs. Additionally, the possibility of achieving light emission above the Planck limit at some frequency ranges is envisaged.
Figures
© 2019 American Chemical Society. Source: R. Fenollosa et al., ACS Photonics 6(12), 3174-3179 (2019), DOI 10.1021/acsphotonics.9b01513. Reused by the authors on a personal website under the ACS author reuse policy.
© 2019 American Chemical Society. Source: R. Fenollosa et al., ACS Photonics 6(12), 3174-3179 (2019), DOI 10.1021/acsphotonics.9b01513. Reused by the authors on a personal website under the ACS author reuse policy.
© 2019 American Chemical Society. Source: R. Fenollosa et al., ACS Photonics 6(12), 3174-3179 (2019), DOI 10.1021/acsphotonics.9b01513. Reused by the authors on a personal website under the ACS author reuse policy.
© 2019 American Chemical Society. Source: R. Fenollosa et al., ACS Photonics 6(12), 3174-3179 (2019), DOI 10.1021/acsphotonics.9b01513. Reused by the authors on a personal website under the ACS author reuse policy.
How to cite
Article access and reuse
The Version of Record is available from ACS Publications and is not hosted on this website. ACS permits authors to reuse their own figures and artwork on personal or institutional websites for non-commercial purposes when the published article is properly cited and any modifications are identified. The four figures below are the unmodified complete compositions extracted from the article PDF.
Related publications

Research fields
Bottom-up
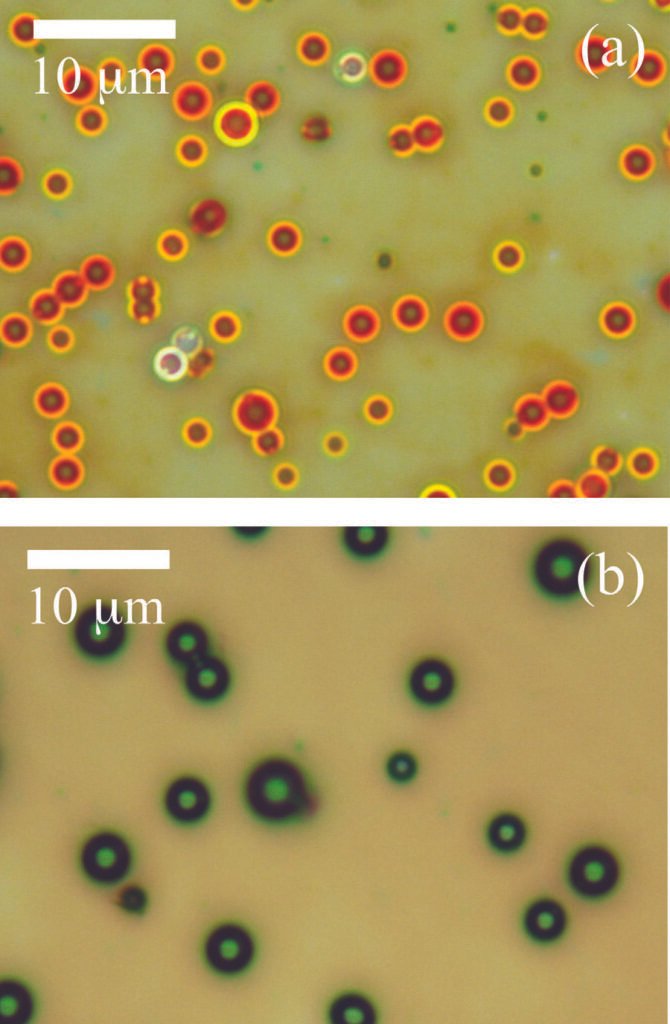
Polycrystalline silicon microspheres supply wavelength-scale resonators with smooth curved boundaries. Their particle-based formation avoids defining the cavity by planar lithography while retaining a high refractive-index optical volume.
Simulations & fits
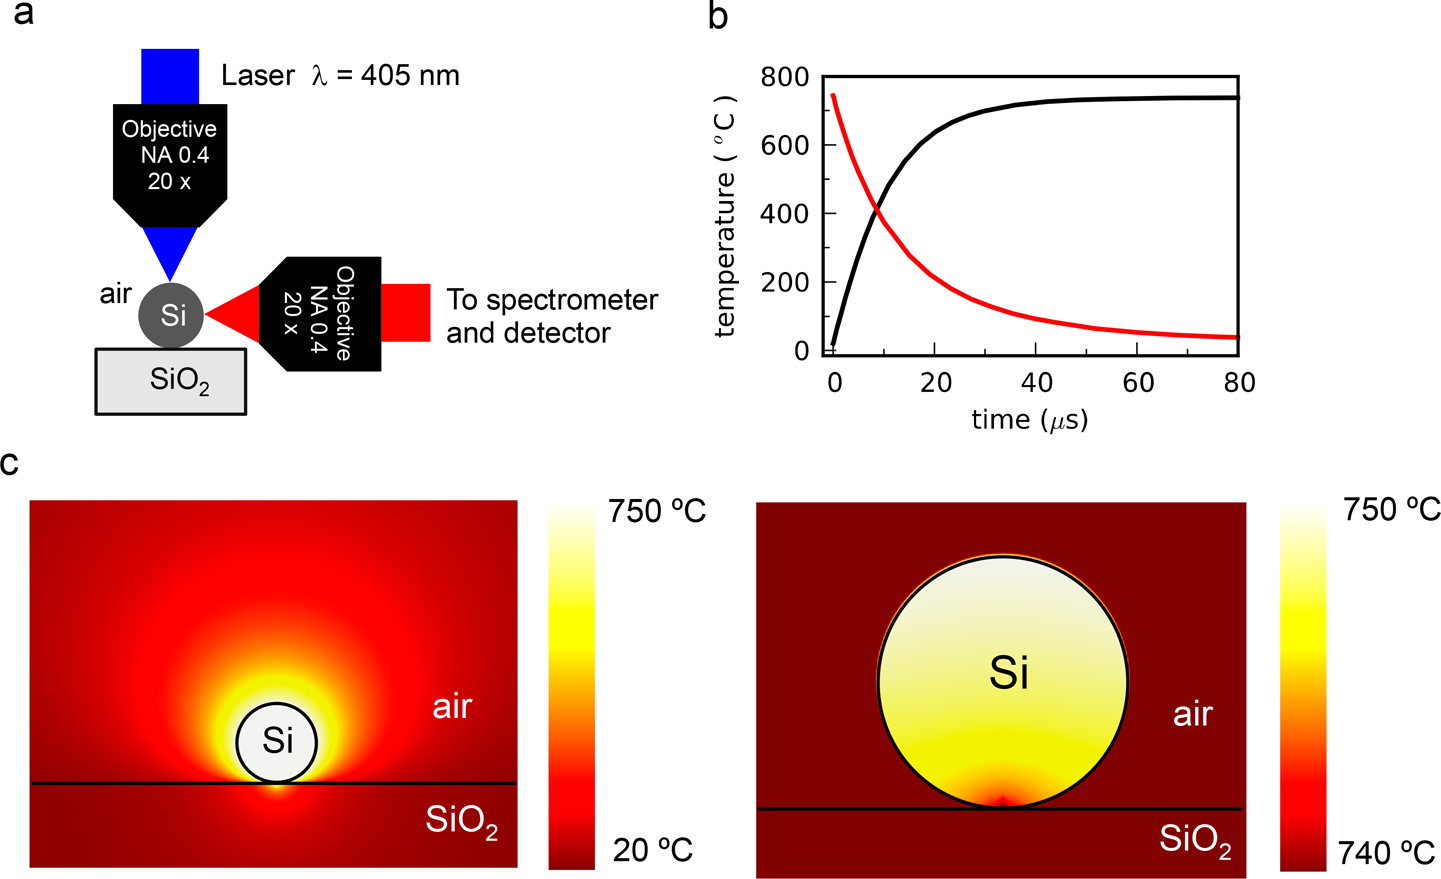
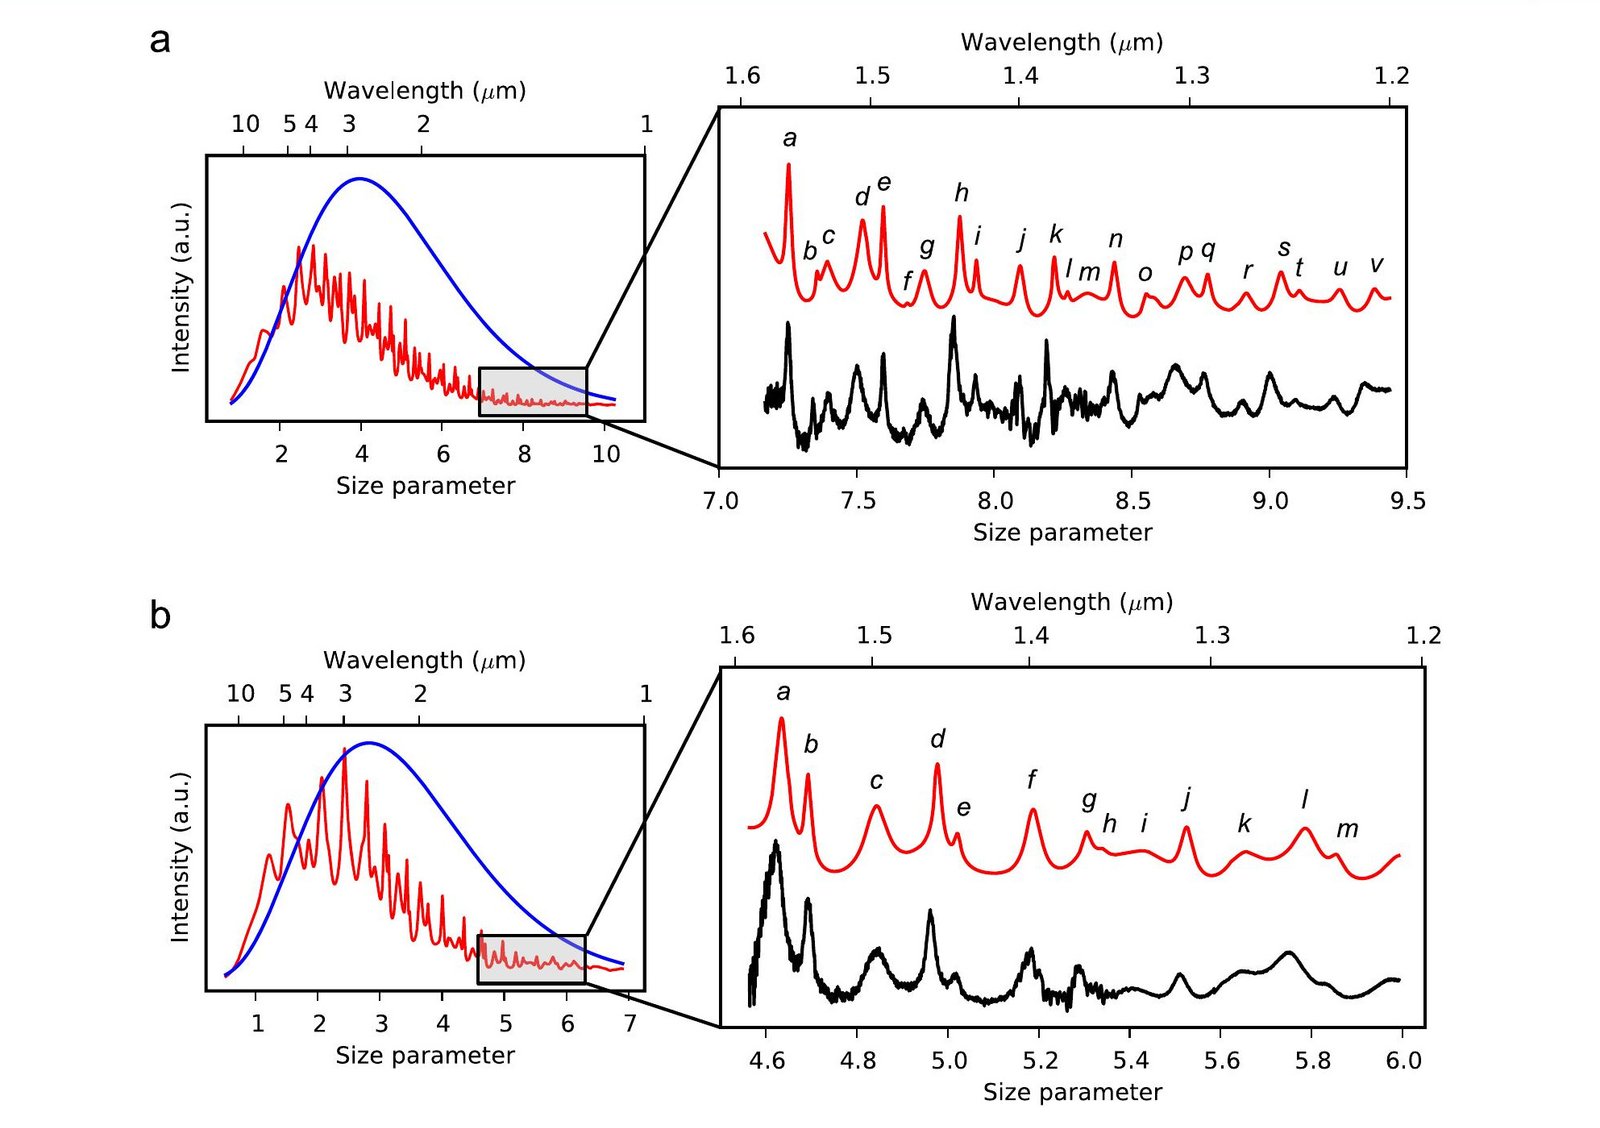
Mie-theory fits assign the measured near-infrared emission peaks and determine the sphere temperature. Finite-element heat-transfer calculations map the steady temperature distribution and predict microsecond heating and cooling, linking optical resonances with the thermal dynamics of one particle.
Characterization
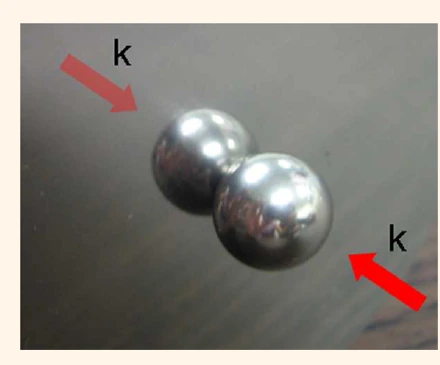
A focused blue laser heats an individual sphere while its near-infrared spectrum is collected parallel to the substrate. The experiment resolves modes with quality factors around 400 and compares their intensity with the blackbody emission expected from the sphere's projected area.
RESEARCH TOPICS
 EmissionThe peaks coincide with calculated Mie modes, demonstrating that thermal radiation is filtered by the particle's own electromagnetic resonances. The work also identifies spectral intervals where the absorption cross-section could support super-Planckian emission.
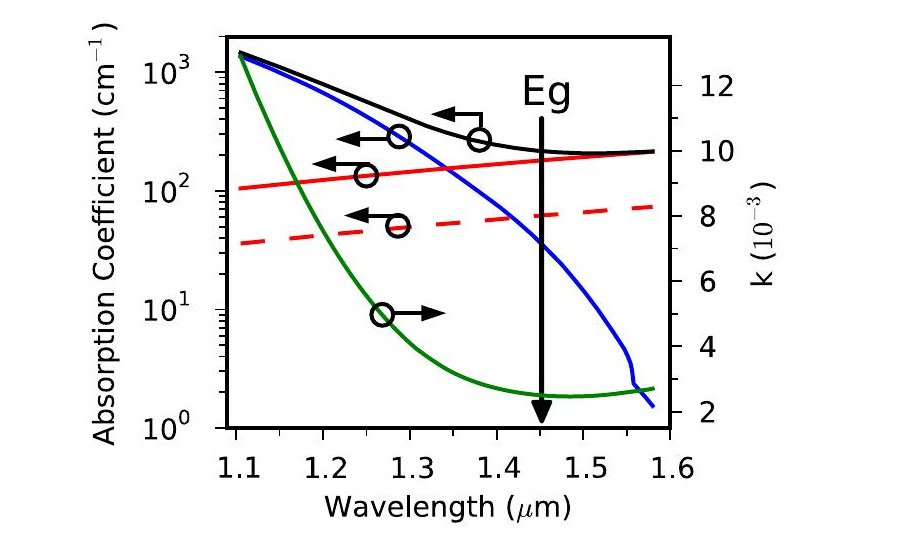
 MaterialsTheir high refractive-index contrast provides confinement, while the temperature-dependent carrier population supplies loss and emission. The experiment therefore relies on a controlled balance: enough absorption to radiate, but not so much that the resonances are washed out.
 ResonatorsBecause the sphere is comparable to the emitted wavelength in all three dimensions, it behaves as a compact photonic cavity rather than an extended patterned surface. The same particle can therefore combine micrometre dimensions, high-Q emission and rapid heating-cooling dynamics.
 SetupsA 405 nm laser is focused onto one sphere supported on silica, and the emitted light is collected in a plane parallel to the substrate to reduce contamination from reflected pump light. That thermal modelling is essential because the laser power is controlled directly, whereas the resonant emission must be interpreted at the sphere's actual temperature.