Research · Publication & note
Silicon Microspheres for Super-Planckian Light Sources in the Mid Infrared - Notes
Journal article
Published abstract
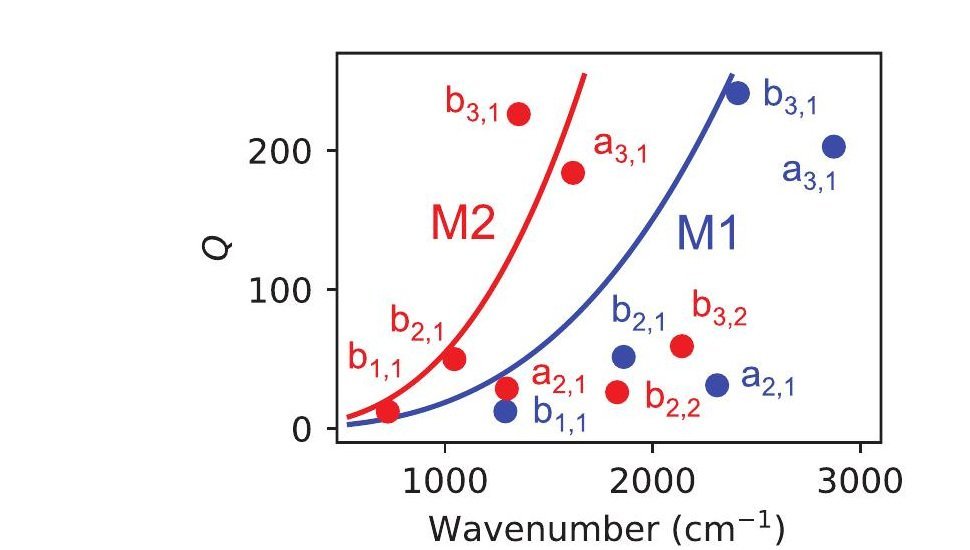
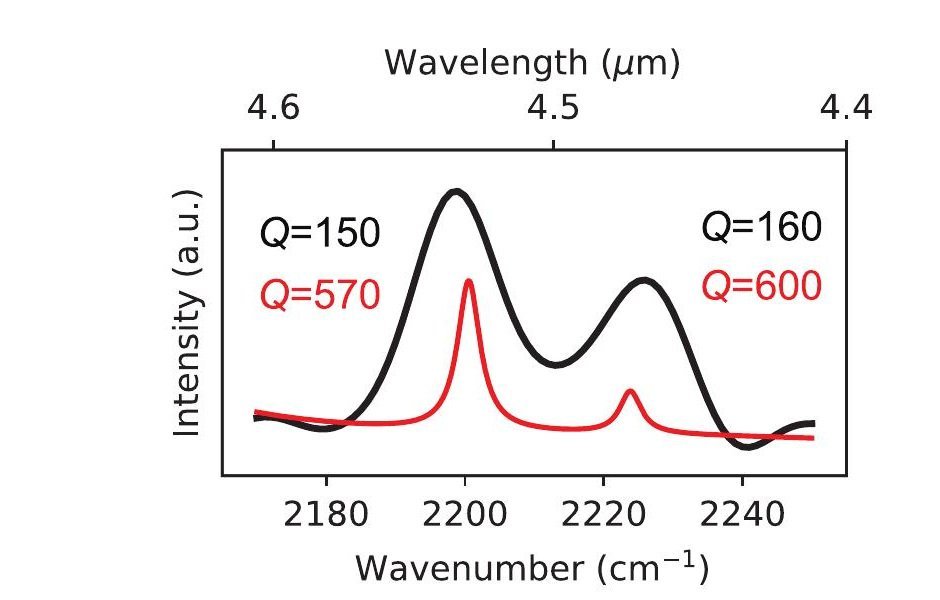
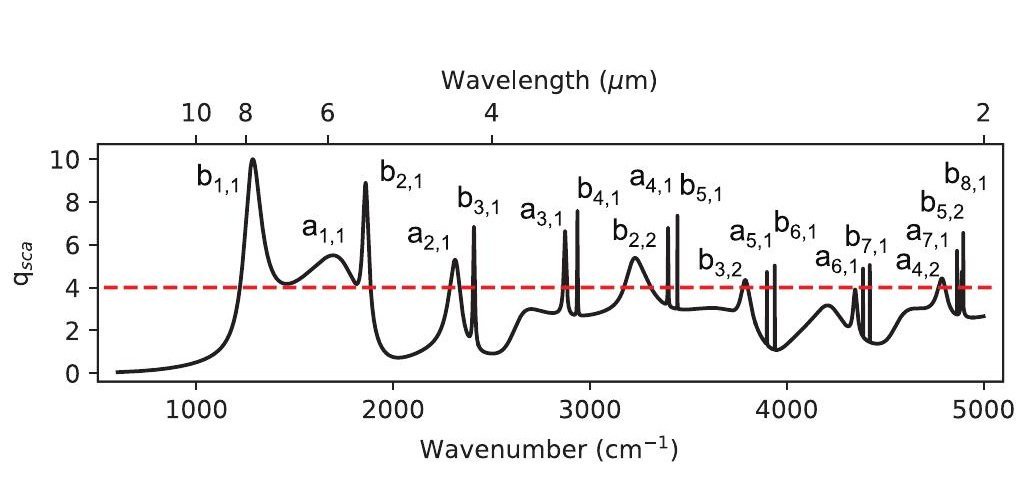
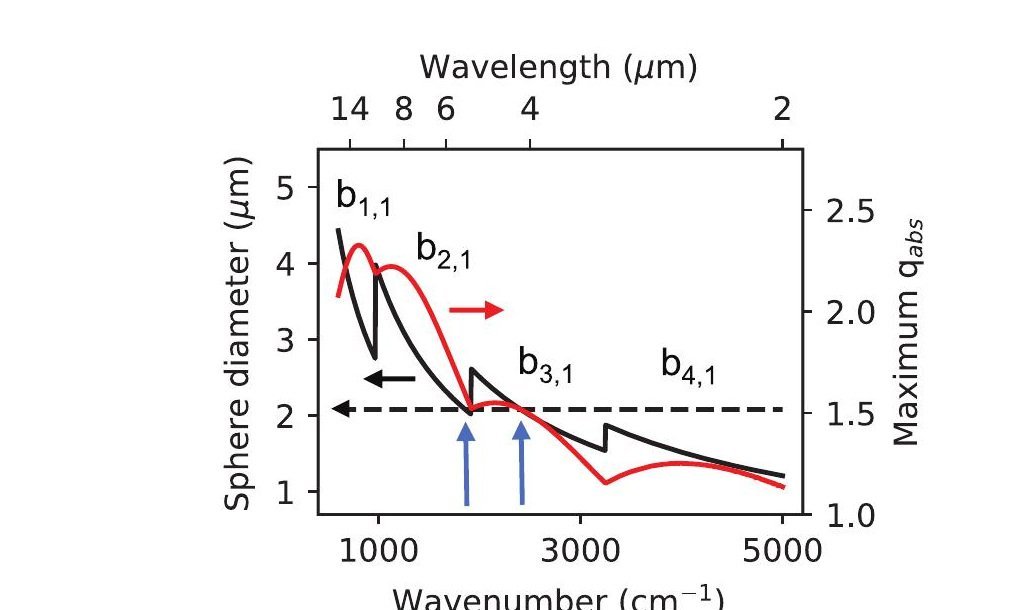
Silicon microspheres with a diameter in the range of 2-3 micrometers constitute photonic nanocavities that emit light through their Mie resonances when heated at high temperatures. At 500-600 °C these microresonators show a particular mid-infrared (MIR) emission dominated by the lowest order modes. Such resonances feature a large free spectral range, about 600 cm−1, and a high proximity to the critical coupling condition. In fact, resonances with high-quality factor, around 160 are found. It corresponds to the limit of detection of their measuring setup, being 600 the theoretical value. Most importantly, several modes emit light above the calculated blackbody limit because they feature an optical absorption cross-section larger than their geometric one. All these characteristics set silicon microspheres as very promising zero-dimensional materials for developing micrometric and sub-wavelength light sources in the MIR.
Figures
© 2023 The Authors. Source: R. Fenollosa et al., Advanced Optical Materials 11(15), 2300135 (2023), DOI 10.1002/adom.202300135. Licensed under CC BY 4.0.
© 2023 The Authors. Source: R. Fenollosa et al., Advanced Optical Materials 11(15), 2300135 (2023), DOI 10.1002/adom.202300135. Licensed under CC BY 4.0.
© 2023 The Authors. Source: R. Fenollosa et al., Advanced Optical Materials 11(15), 2300135 (2023), DOI 10.1002/adom.202300135. Licensed under CC BY 4.0.
© 2023 The Authors. Source: R. Fenollosa et al., Advanced Optical Materials 11(15), 2300135 (2023), DOI 10.1002/adom.202300135. Licensed under CC BY 4.0.
© 2023 The Authors. Source: R. Fenollosa et al., Advanced Optical Materials 11(15), 2300135 (2023), DOI 10.1002/adom.202300135. Licensed under CC BY 4.0.
© 2023 The Authors. Source: R. Fenollosa et al., Advanced Optical Materials 11(15), 2300135 (2023), DOI 10.1002/adom.202300135. Licensed under CC BY 4.0.
© 2023 The Authors. Source: R. Fenollosa et al., Advanced Optical Materials 11(15), 2300135 (2023), DOI 10.1002/adom.202300135. Licensed under CC BY 4.0.
How to cite
Article access and reuse
The Version of Record is openly available from Wiley. © 2023 The Authors. Advanced Optical Materials published by Wiley-VCH GmbH. The article is distributed under the Creative Commons Attribution License, which permits use, distribution and reproduction in any medium provided that the original work is properly cited. The figures below reproduce the complete original compositions from the article PDF without modification.
Related publications

Research fields
Bottom-up
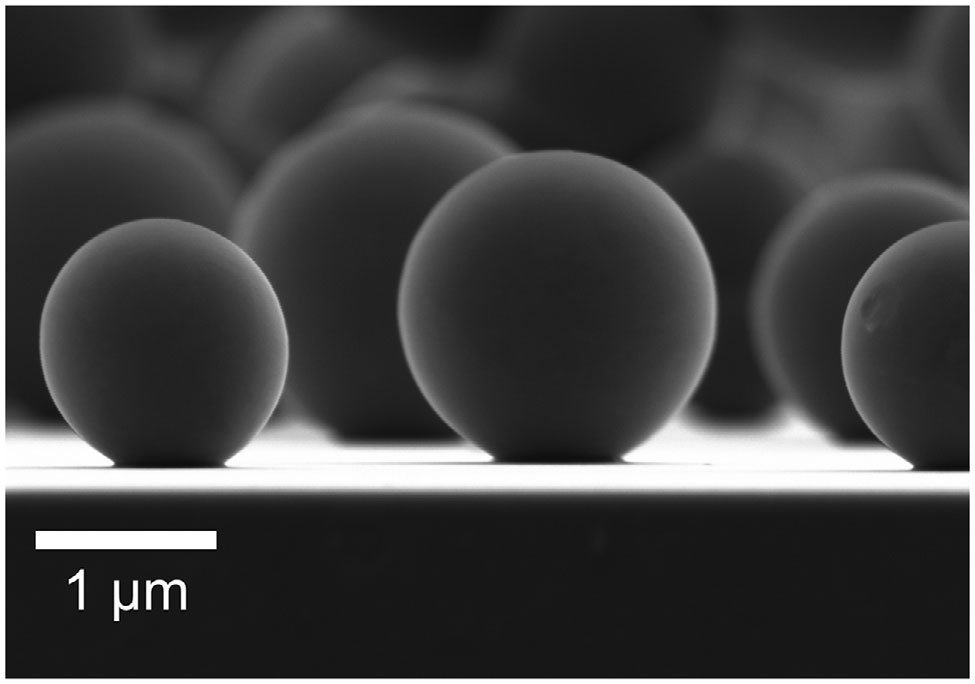
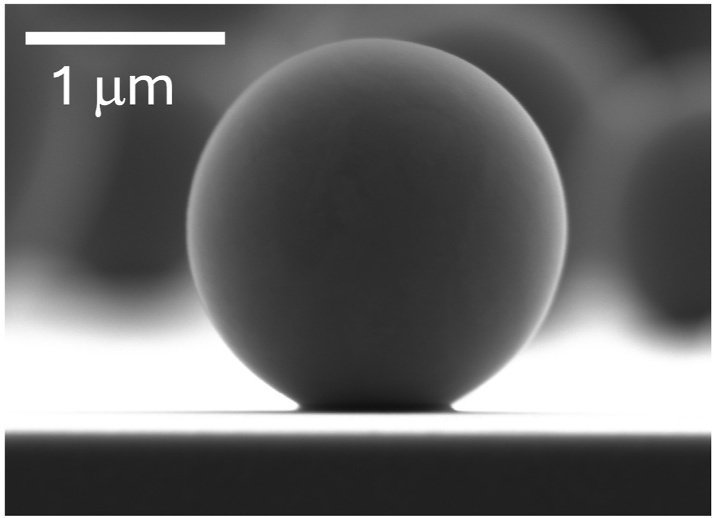
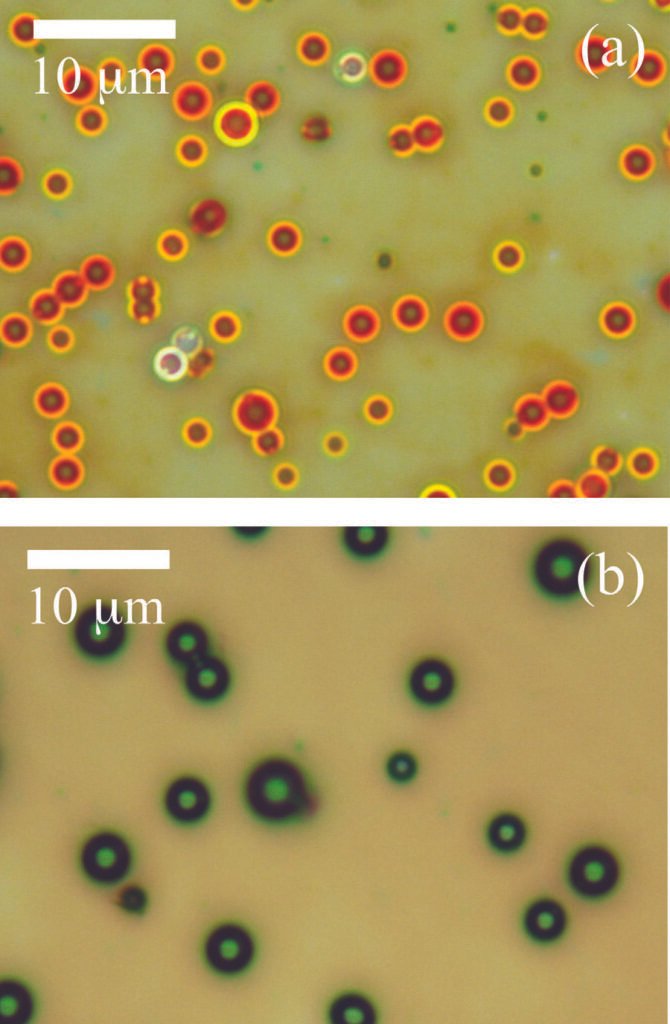
Micrometre-scale polycrystalline silicon spheres form the resonant emitters. Their smooth spherical geometry is obtained without lithographically defining a cavity, allowing the particle diameter itself to set the mid-infrared mode structure.
Simulations & fits
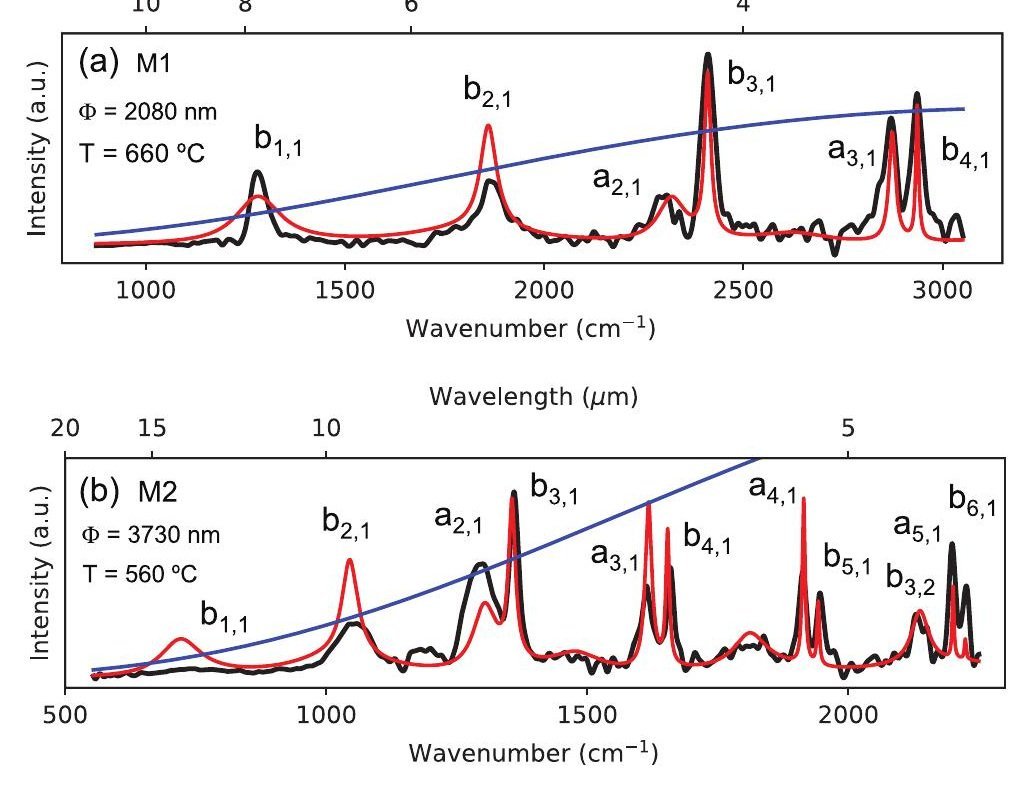
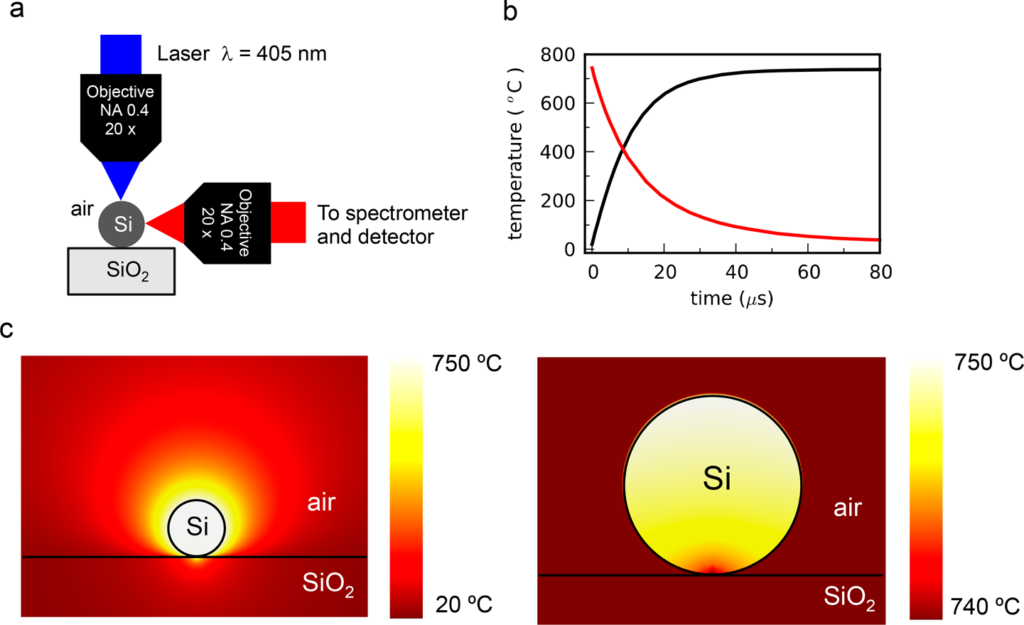
Measured thermal spectra are fitted with Mie theory to determine the particle temperature and assign individual electric and magnetic resonances. The same model evaluates absorption efficiency, radiative losses and the conditions under which emission can exceed the projected-area blackbody limit.
Characterization
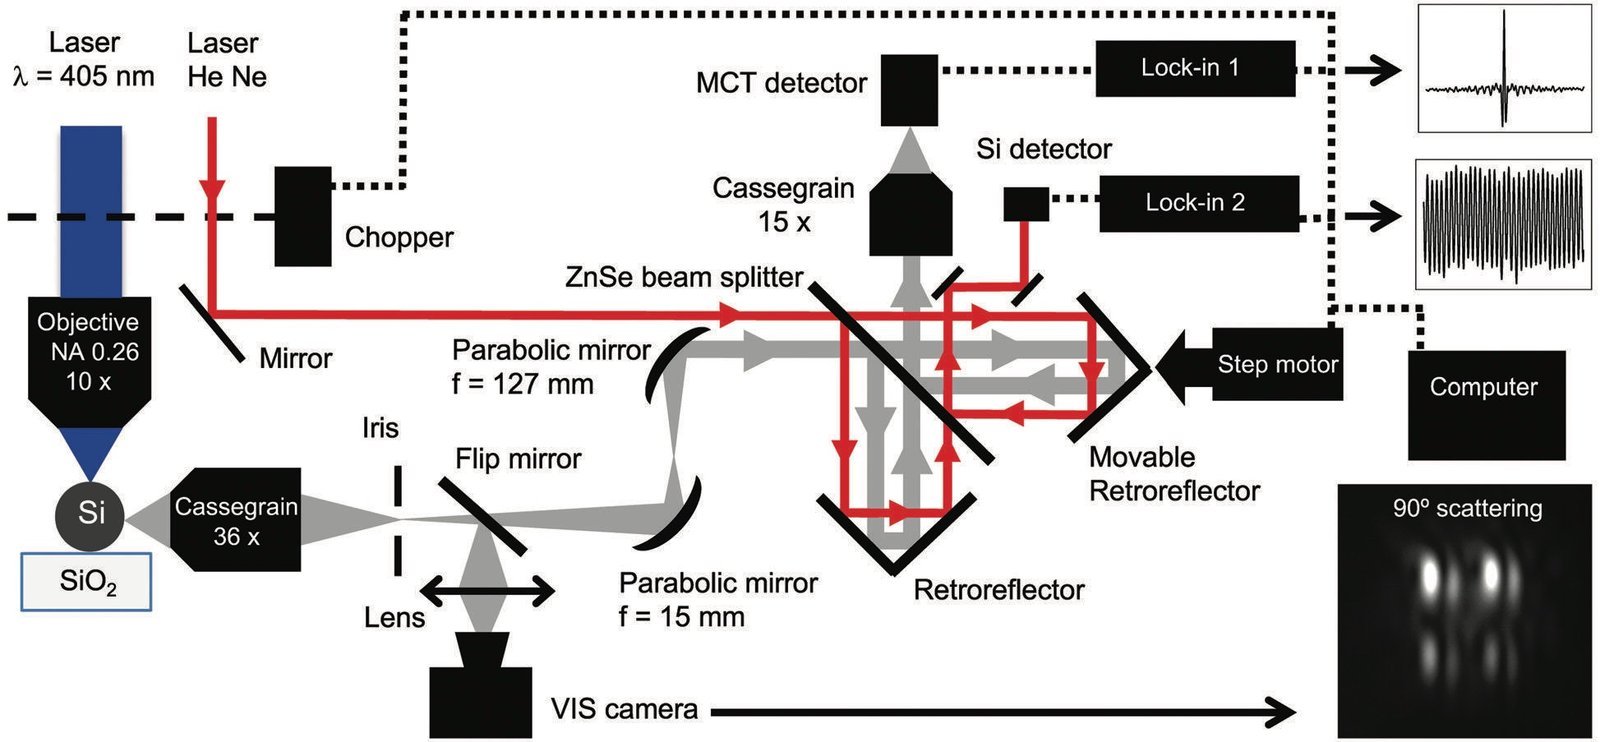
A dedicated single-particle interferometric setup heats each sphere with a focused blue laser and collects its mid-infrared radiation through a Cassegrain objective. Correlated SEM sizing and spectral measurements resolve high-Q peaks across the atmospheric transparency windows.
RESEARCH TOPICS
 EmissionThe measured mid-infrared spectrum contains narrow thermal-emission peaks at the Mie resonances of each silicon microsphere. Several peaks rise above the Planckian reference for the projected particle area, showing how a wavelength-scale emitter can exceed that reference within selected spectral intervals.
 MaterialsCrystalline silicon combines a high refractive index with temperature-dependent absorption, allowing a single microsphere to confine and emit mid-infrared light resonantly. The material response and the spherical geometry therefore work together to set the position and strength of the thermal-emission peaks.
 ResonatorsEach silicon microsphere behaves as a three-dimensional Mie resonator whose low-order modes remain spectrally distinct in the mid infrared. Their proximity to critical coupling explains the strong, selective emission and provides a route towards compact resonant thermal sources.
 SetupsA purpose-built Fourier-transform infrared system isolates the weak emission of one laser-heated microsphere from the thermal background. Phase-calibrated interferometry and synchronous detection make it possible to resolve the resonances and compare them quantitatively with Mie theory and the Planckian reference.