Research · Publication & note
Thermal emission of hydrogenated amorphous silicon microspheres in the mid-infrared - Notes
Journal article
Published abstract
Hydrogenated amorphous silicon microspheres feature a pronounced phononic peak around 2000 cm-1 when they are thermally excited by means of a blue laser. This phononic signature corresponds to vibrational modes of silicon-hydrogen bonds and its emitted light can be coupled to Mie modes defined by the spherical cavity. The signal is apparently quite stable at moderate excitation intensities although there appeared some signs pointing to hydrides bonds reconfiguration and even hydrogen emission. Above a certain excitation threshold, a phase change from amorphous to poly-crystalline silicon occurs that preserves the good structural quality of the microspheres.
Figures
From R. Fenollosa and F. Ramiro-Manzano, International Journal of Thermal Sciences 213, 109829 (2025), DOI 10.1016/j.ijthermalsci.2025.109829. © 2025 The Authors. CC BY 4.0.
From R. Fenollosa and F. Ramiro-Manzano, International Journal of Thermal Sciences 213, 109829 (2025), DOI 10.1016/j.ijthermalsci.2025.109829. © 2025 The Authors. CC BY 4.0.
From R. Fenollosa and F. Ramiro-Manzano, International Journal of Thermal Sciences 213, 109829 (2025), DOI 10.1016/j.ijthermalsci.2025.109829. © 2025 The Authors. CC BY 4.0.
From R. Fenollosa and F. Ramiro-Manzano, International Journal of Thermal Sciences 213, 109829 (2025), DOI 10.1016/j.ijthermalsci.2025.109829. © 2025 The Authors. CC BY 4.0.
From R. Fenollosa and F. Ramiro-Manzano, International Journal of Thermal Sciences 213, 109829 (2025), DOI 10.1016/j.ijthermalsci.2025.109829. © 2025 The Authors. CC BY 4.0.
From R. Fenollosa and F. Ramiro-Manzano, International Journal of Thermal Sciences 213, 109829 (2025), DOI 10.1016/j.ijthermalsci.2025.109829. © 2025 The Authors. CC BY 4.0.
How to cite
Article access and reuse
This is an open-access article published by Elsevier Masson SAS under the Creative Commons Attribution 4.0 International licence (CC BY 4.0). © 2025 The Authors; the authors retain copyright and grant Elsevier a licence to publish. The figures below were extracted from the local article PDF without enlargement or reconstruction and are reproduced with attribution. The licence permits sharing and adaptation provided appropriate credit is given, the licence is linked and changes are indicated. Elsevier copyright policy.
Related publications

Research fields
Bottom-up
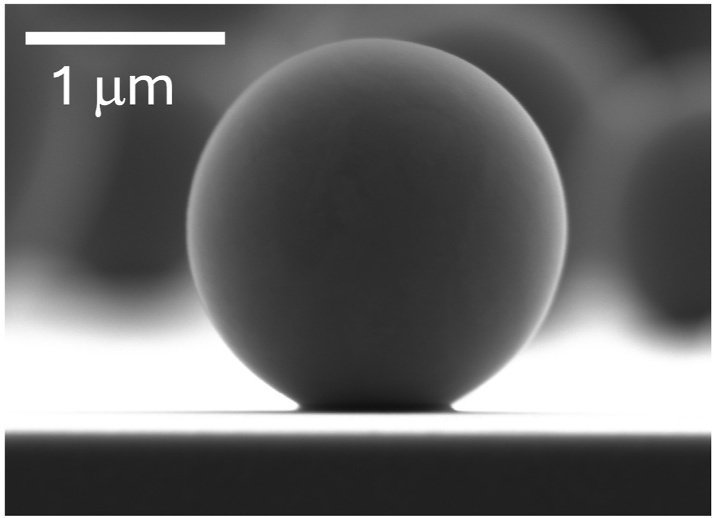
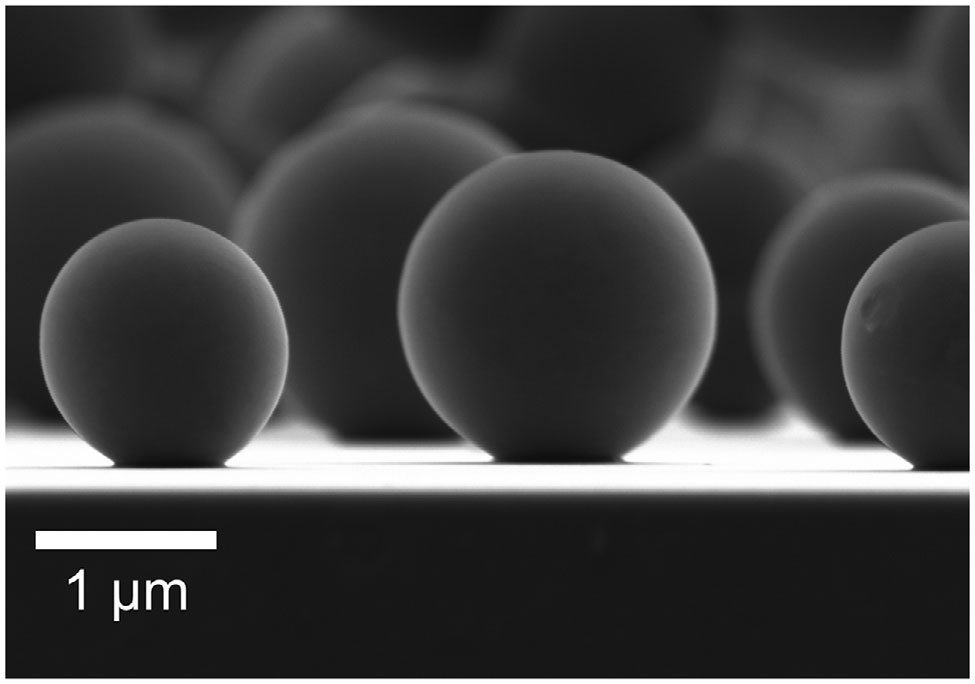
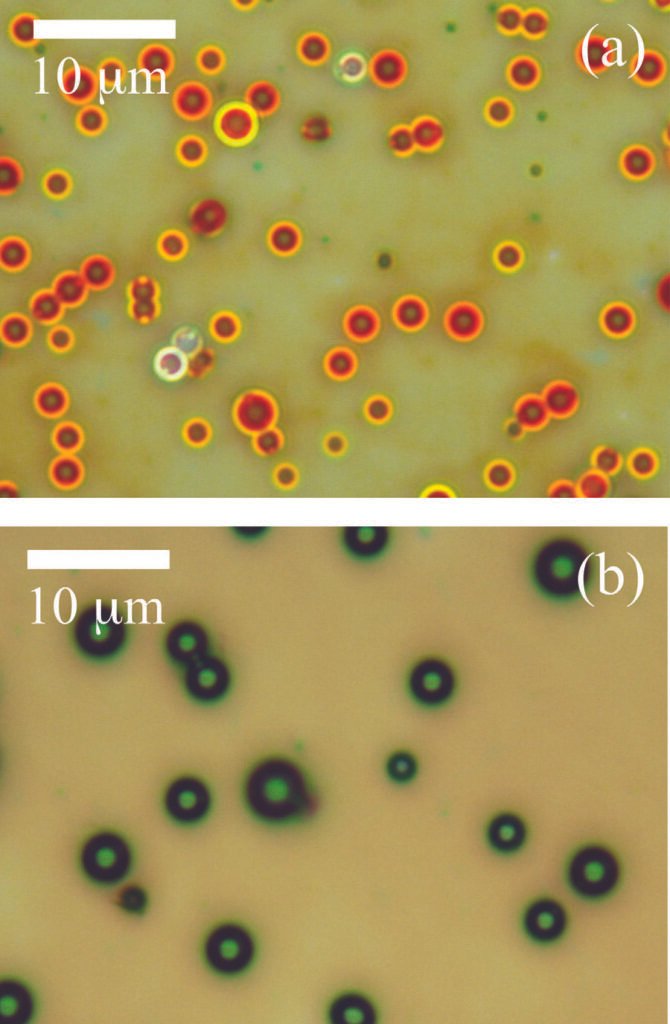
Hydrogenated amorphous-silicon microspheres provide the material platform. Their gas-phase synthesis produces smooth, micrometre-scale particles whose silicon-hydride content supplies the mid-infrared vibrational emission investigated in the work.
Simulations & fits
Mie calculations connect the resonant peaks that emerge after laser-induced crystallisation with the diameter and optical response of the resulting silicon cavity, separating those resonances from the broader hydride-related emission.
Characterization
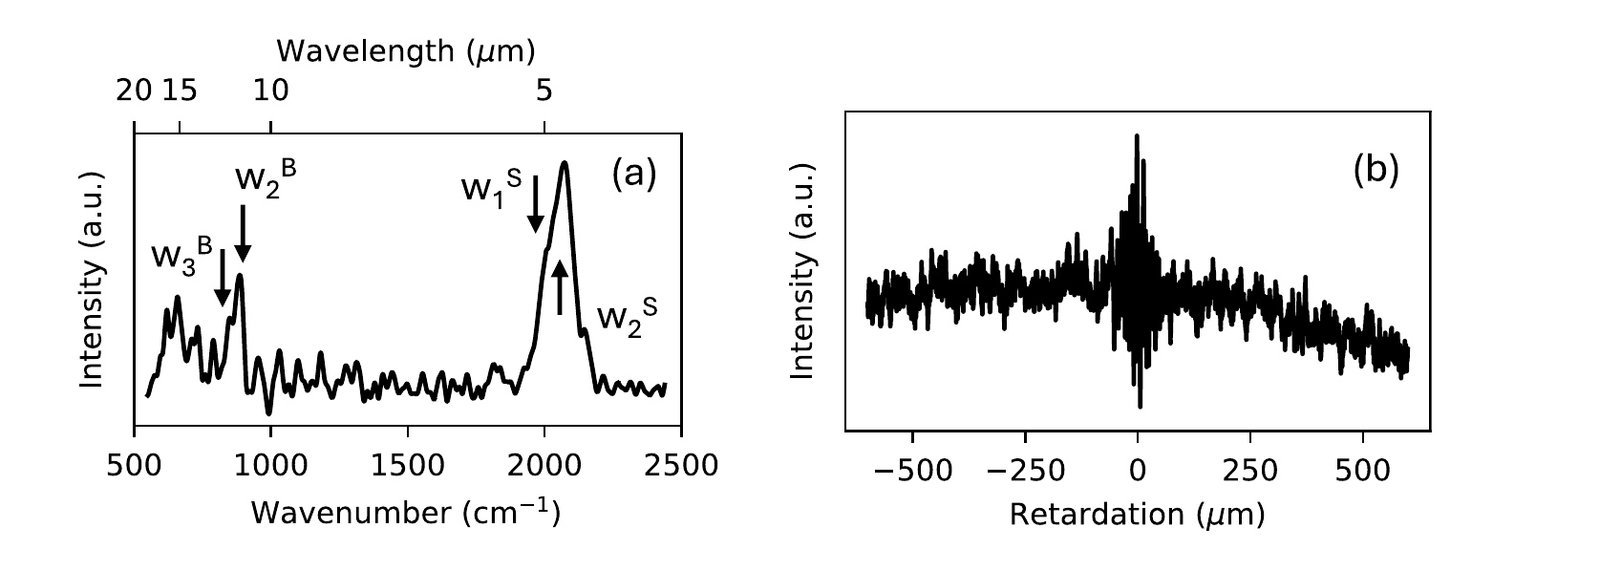
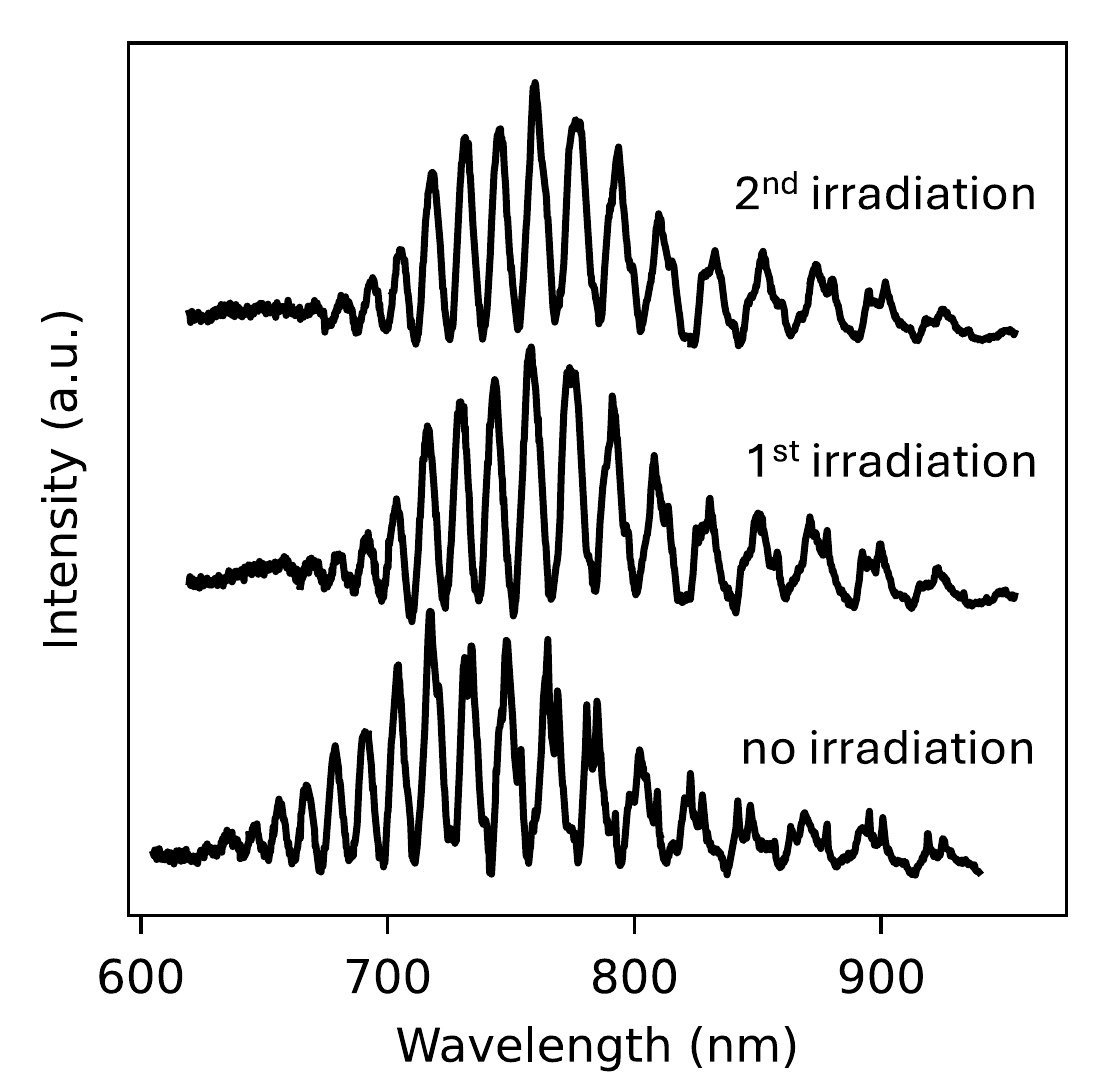
Single-particle interferometric emission and visible-to-near-infrared scattering measurements follow the same microsphere before and after controlled laser exposure. The comparison resolves hydride emission near 2000 cm⁻¹ and the subsequent appearance of crystalline-silicon Mie modes.
RESEARCH TOPICS
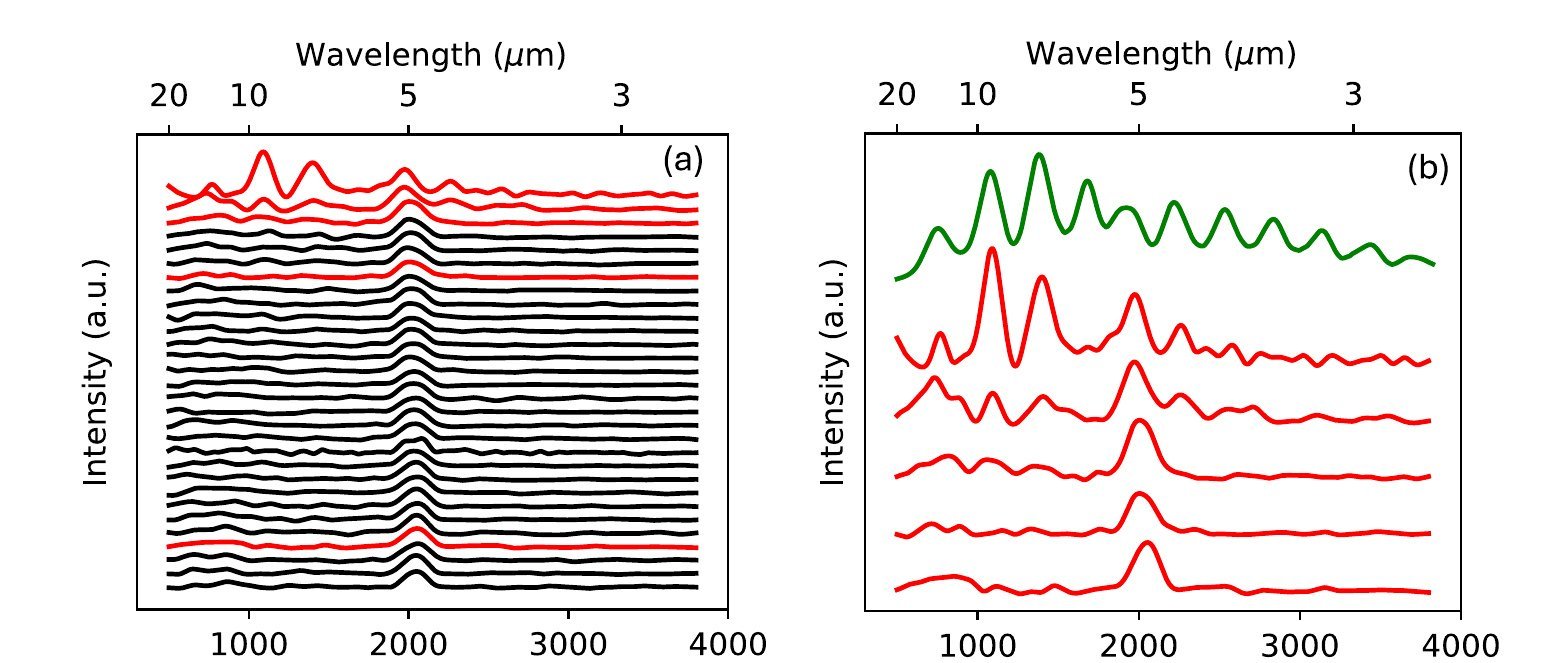
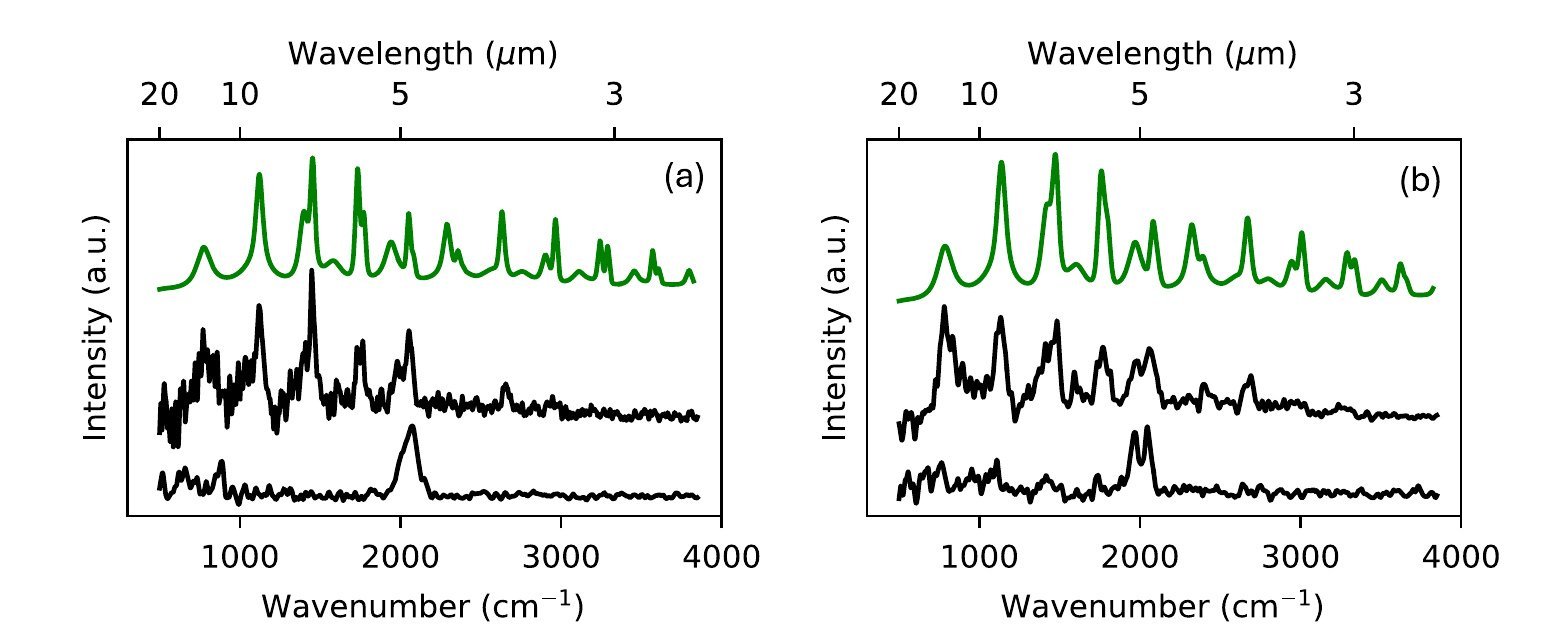
 CouplingThe microsphere does more than emit a broad thermal background. Figures 4 and 6 make that connection visible: once the emission regime changes, narrow resonant peaks appear, and their spectral positions are compared with Mie-theory calculations for crystalline-silicon spheres.
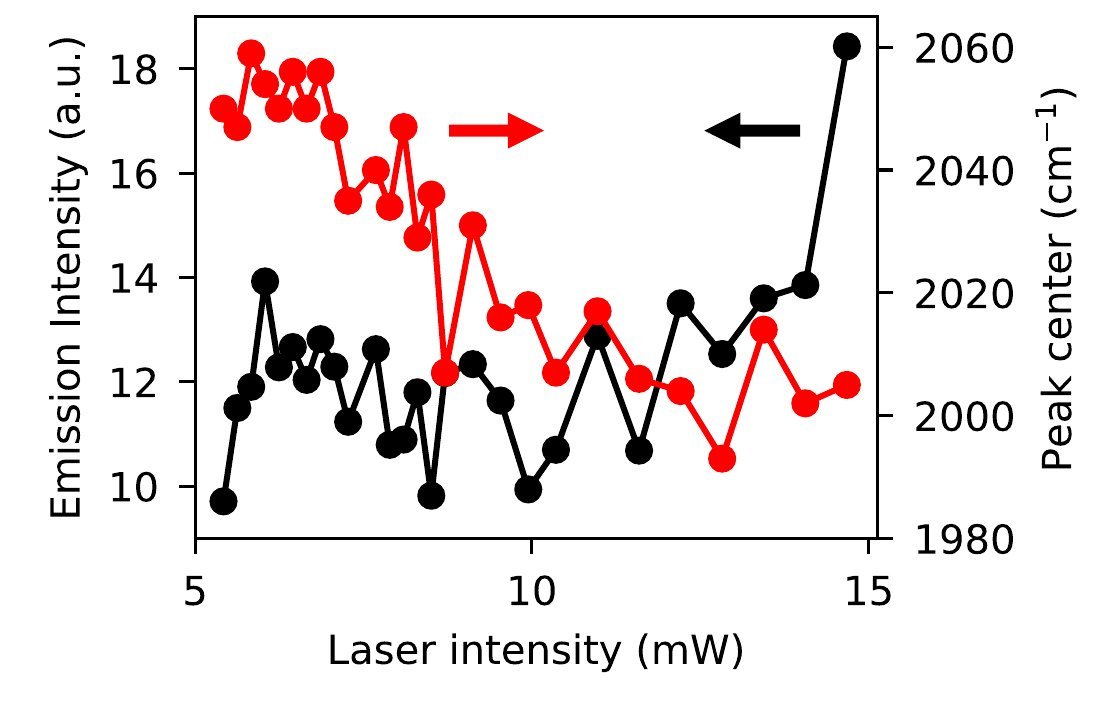
 EmissionAt moderate excitation, the most distinctive signal is a mid-infrared band associated with silicon-hydrogen vibrations rather than the free-carrier spectrum normally expected from hot crystalline silicon. Figure 5 then follows how the integrated intensity and centre of this band evolve as the 405 nm laser power is increased, before the spectrum changes irreversibly.
 MaterialsThe optical experiment also acts as a probe of a material transformation. The sphere therefore preserves its geometry while its internal structure and refractive response change.
 ResonatorsThese 3-4 μm particles are sufficiently spherical and refractive to behave as Mie resonators without an externally fabricated mirror. In Figure 6 the authors reproduce their positions with Mie simulations for crystalline-silicon spheres of 3540 and 3130 nm diameter, allowing the spectral pattern to be connected to particle size and refractive index rather than treated as an unexplained emission structure.
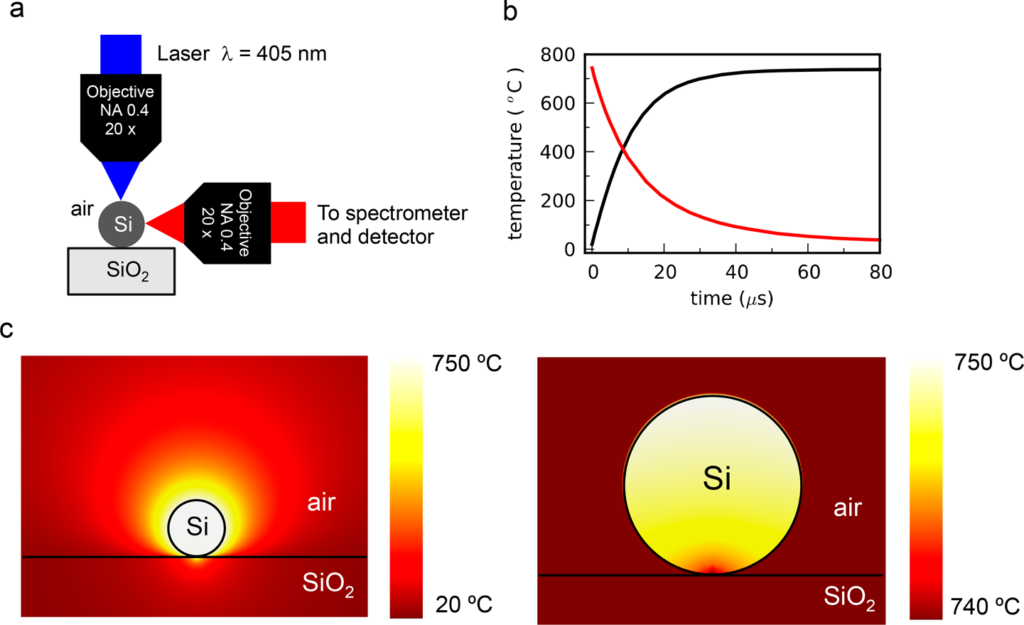
 SetupsThe measurement isolates the weak emission of one microsphere. A liquid-nitrogen-cooled MCT detector and lock-in amplifier recover the modulated signal, while a separate chopped HeNe beam monitors optical-path displacement.
 ChemistryThe spectrum contains information about which hydrogen configurations survive inside the amorphous matrix. At higher excitation, the disappearance of these signatures accompanies irreversible dehydrogenation and crystallisation.