Research · Publication & note
Porous Silicon Microcavities: Synthesis, Characterization, and Application to Photonic Barcode Devices - Notes
Nanoscale Research Letters · Journal article · 3 September 2012
Published abstract
We have recently developed a new type of porous silicon we name as porous silicon colloids. They consist of almost perfect spherical silicon nanoparticles with a very smooth surface, able to scatter (and also trap) light very efficiently in a large-span frequency range. Porous silicon colloids have unique properties because of the following: (a) they behave as optical microcavities with a high refractive index, and (b) the intrinsic photoluminescence (PL) emission is coupled to the optical modes of the microcavity resulting in a unique luminescence spectrum profile. The PL spectrum constitutes an optical fingerprint identifying each particle, with application for biosensing. In this paper, we review the synthesis of silicon colloids for developing porous nanoparticles. We also report on the optical properties with special emphasis in the PL emission of porous silicon microcavities. Finally, we present the photonic barcode concept.
Figures
From F. Ramiro-Manzano et al., Nanoscale Research Letters 7, 497 (2012), DOI 10.1186/1556-276X-7-497. Licensed under CC BY 2.0.
From F. Ramiro-Manzano et al., Nanoscale Research Letters 7, 497 (2012), DOI 10.1186/1556-276X-7-497. Licensed under CC BY 2.0.
How to cite
Article access and reuse
The article is open access under the Creative Commons Attribution 2.0 licence. Figures 3 and 6 are original to this article and are reused under CC BY 2.0. Figures 1, 2, 4 and 5 were reprinted in the article from earlier publications; they are shown here under the verified author-reuse terms of their original RSC, AIP and Wiley sources, with the original publication credited below each figure.
Related publications

Research fields
Bottom-up
Disilane decomposition and subsequent material conversion produce amorphous, polycrystalline and porous silicon colloids with smooth spherical boundaries. In the porous form, the particle combines an intrinsic luminescent network with a self-contained optical microcavity.
Simulations & fits
Mie fits to single-sphere transmission determine effective refractive index and assign the resonant modes. Matching those modes with the porous-silicon emission explains why each particle develops a diameter- and porosity-dependent photonic barcode.
Characterization
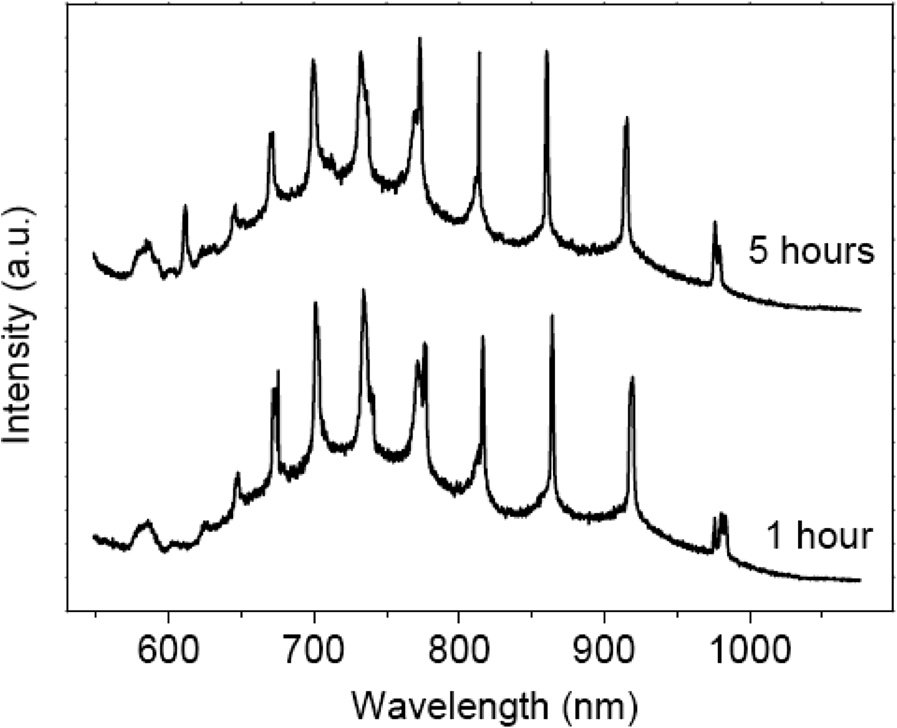
Optical and electron microscopy, infrared chemical analysis, transmission and photoluminescence follow composition, size and resonant response. Exposure-dependent spectral shifts also reveal how oxidation changes the optical fingerprint of one microsphere over time.
RESEARCH TOPICS
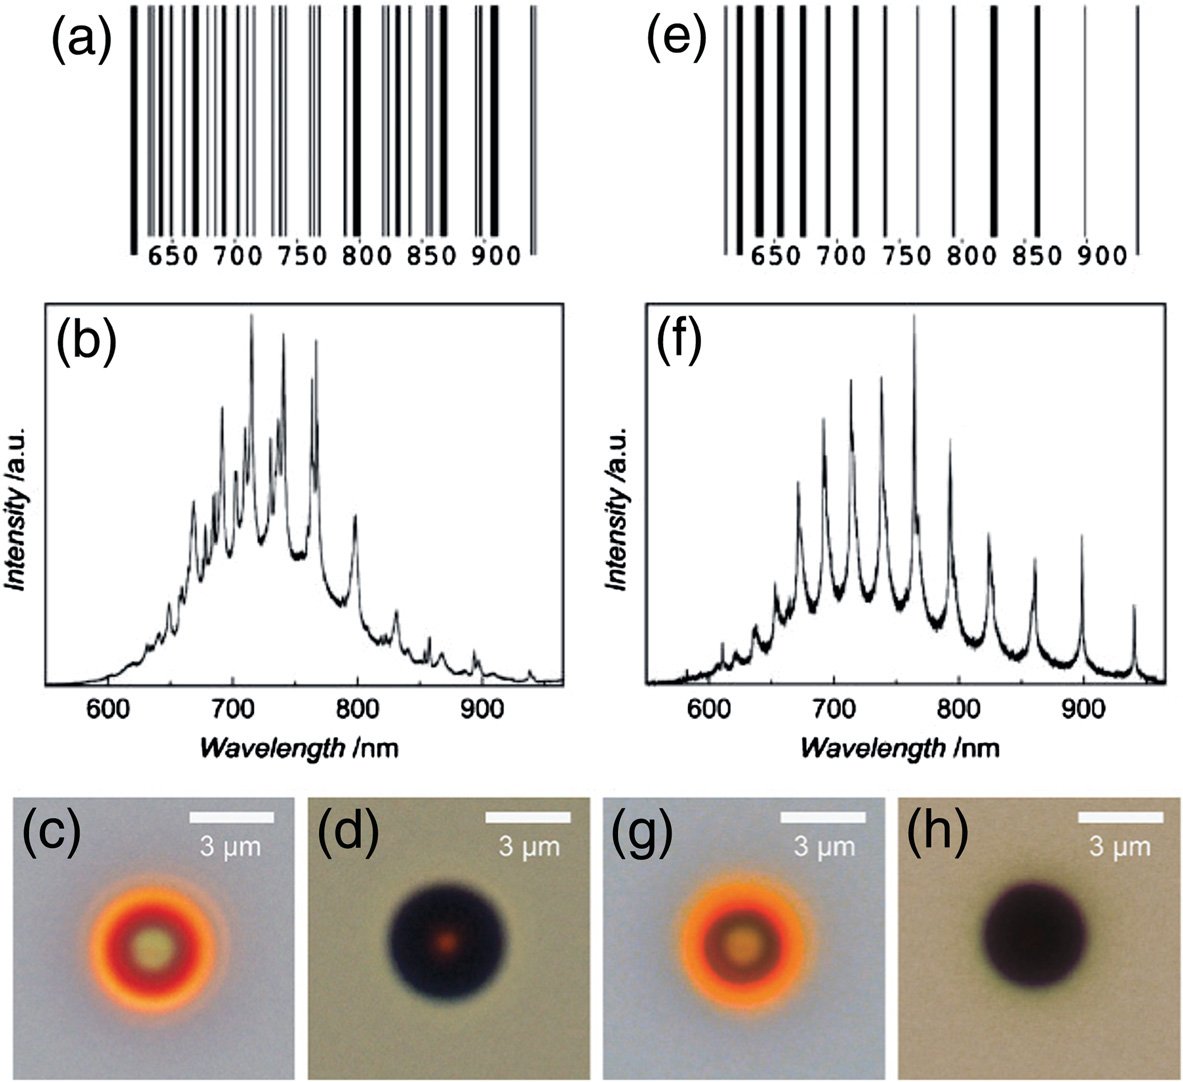
 EmissionPorous silicon supplies its own broad photoluminescence, but the spherical boundary redistributes that light into a comb of narrow resonant peaks. The result is not merely brighter emission: each particle acquires a distinctive spectral fingerprint that can function as an optical barcode.
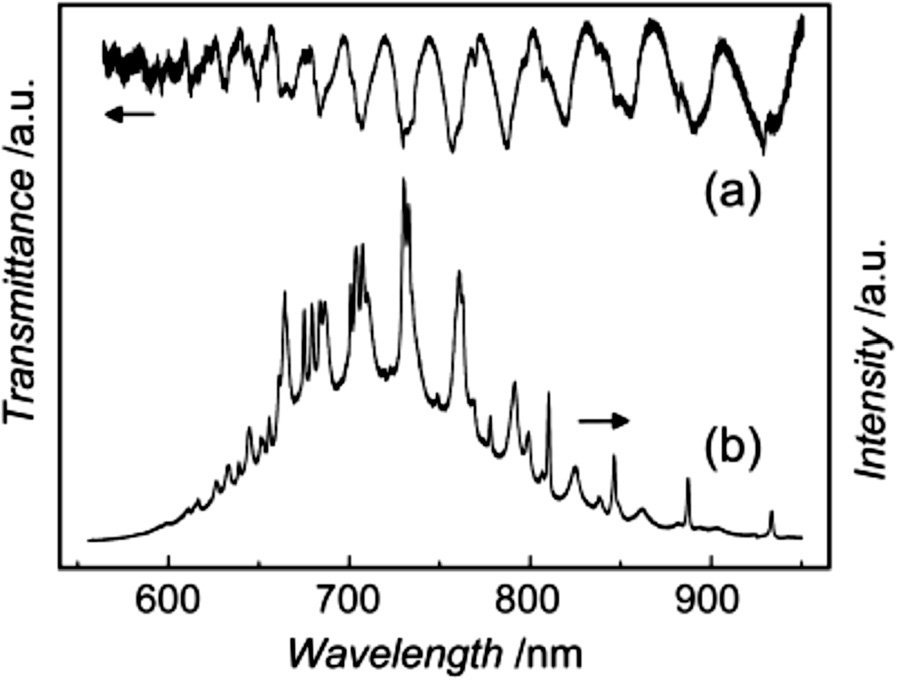
 InterferenceThe narrow lines arise because light circulating inside the high-index sphere interferes constructively only at discrete wavelengths. Figure 4 compares transmission and photoluminescence from the same 4.1 μm particle; the much stronger structure in the luminescence spectrum demonstrates that the internal emitter couples selectively to the allowed cavity fields.
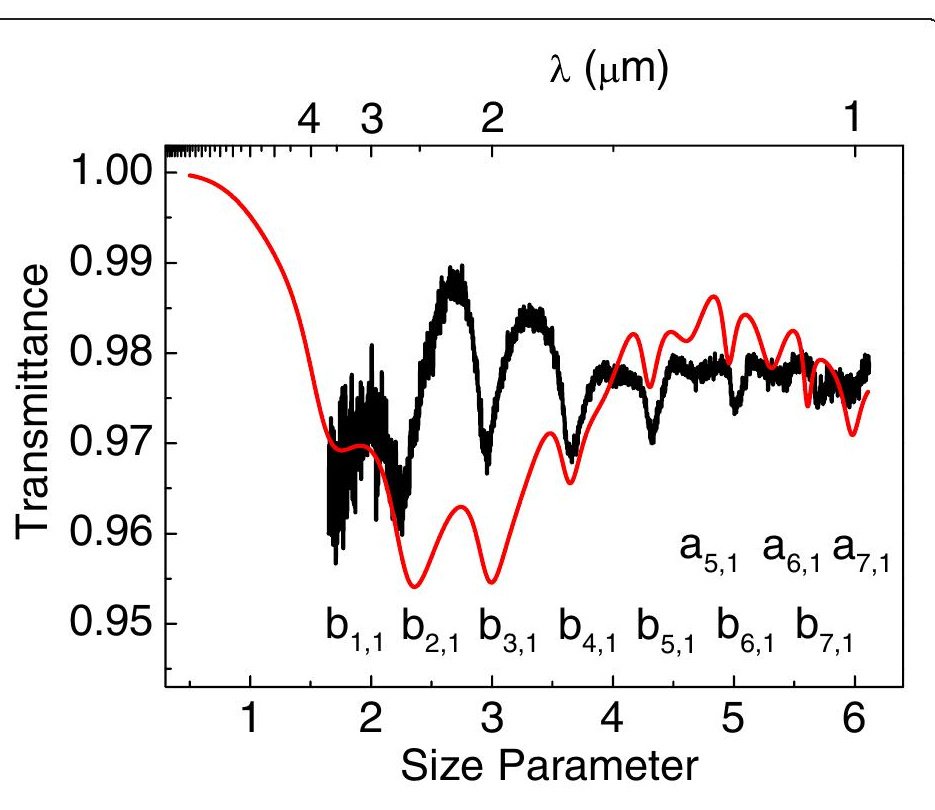
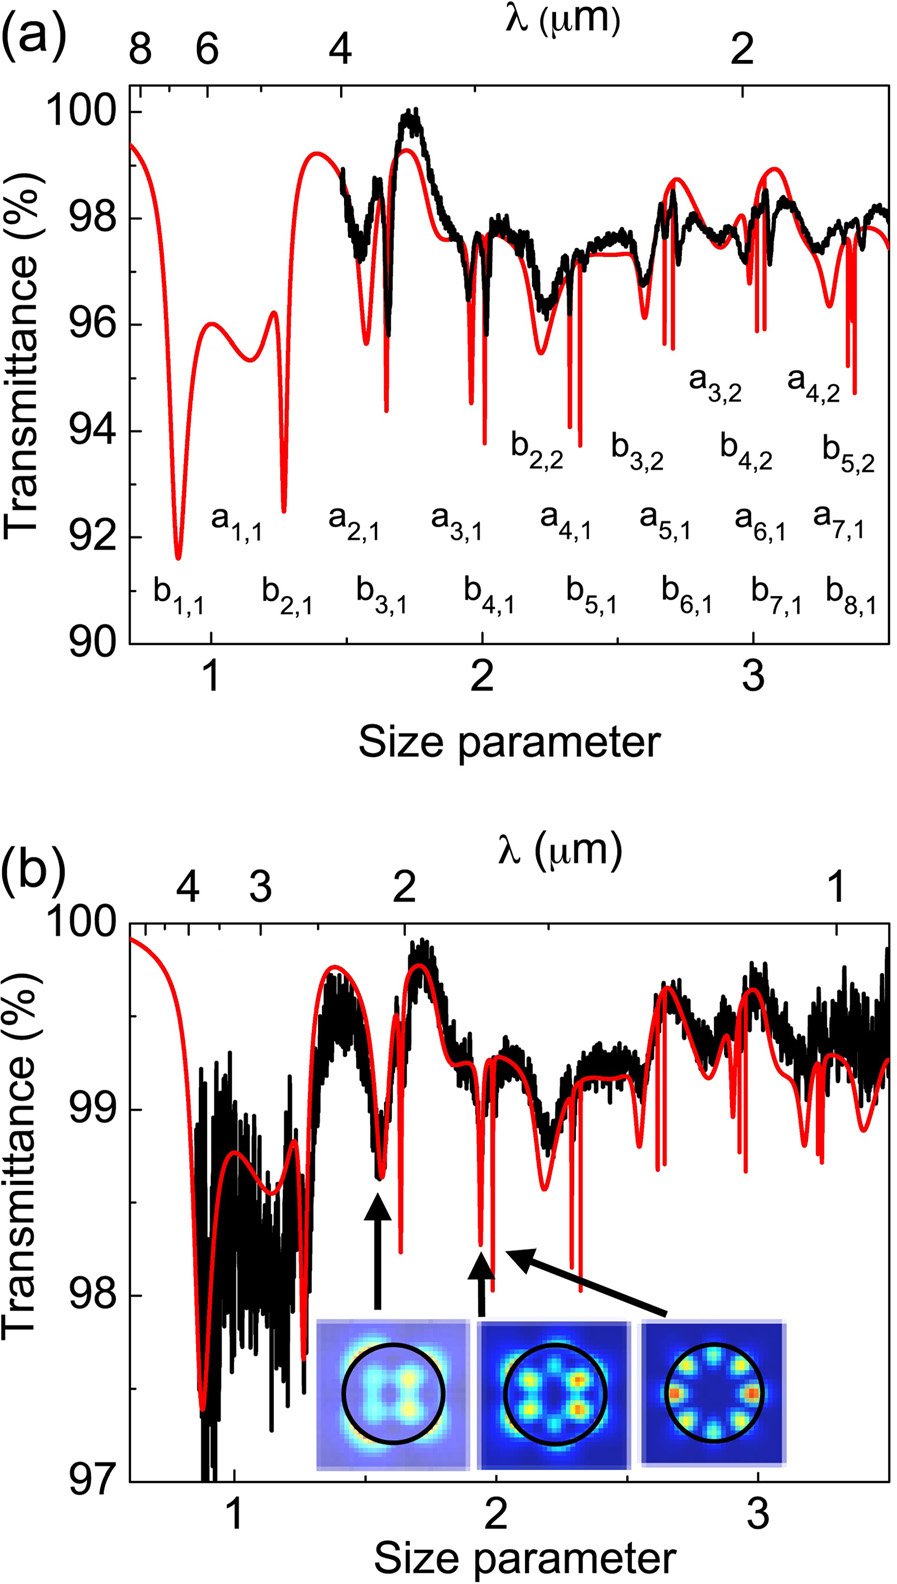
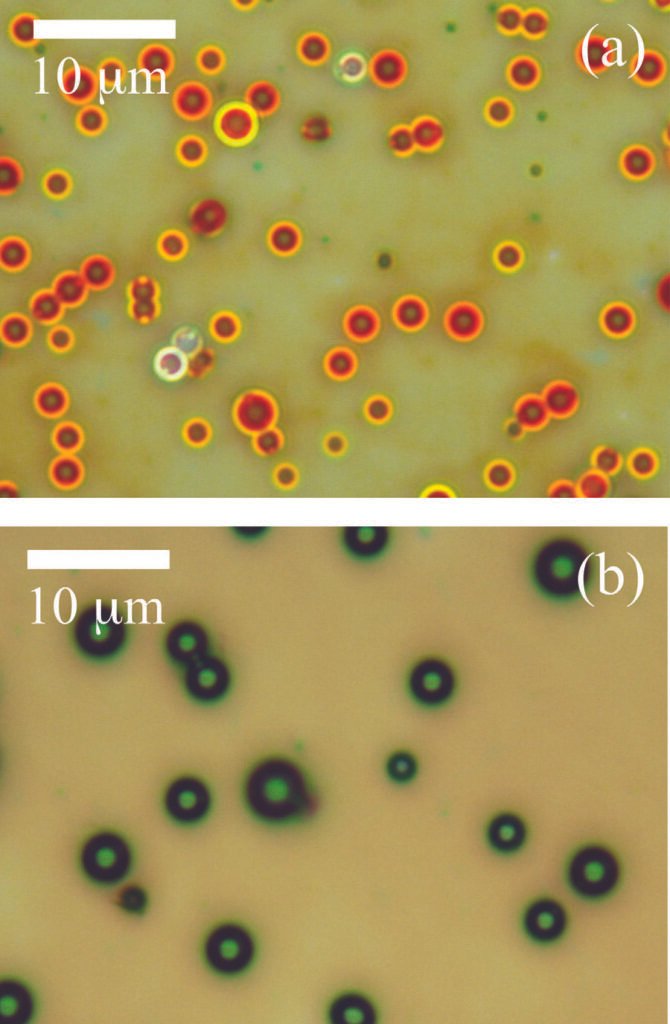
 MaterialsPorosity changes the sphere from homogeneous polycrystalline silicon into an effective medium with a radially non-uniform refractive index. Figures 2 and 3 contrast the optical response of polycrystalline and porous colloids, linking the change in mode positions and scattering to the internal material structure.
 ResonatorsEach microsphere acts as a three-dimensional optical microcavity supporting transverse-electric and transverse-magnetic mode families. Because the resonance pattern depends sensitively on size and internal refractive index, two visually similar spheres can be distinguished spectrally.
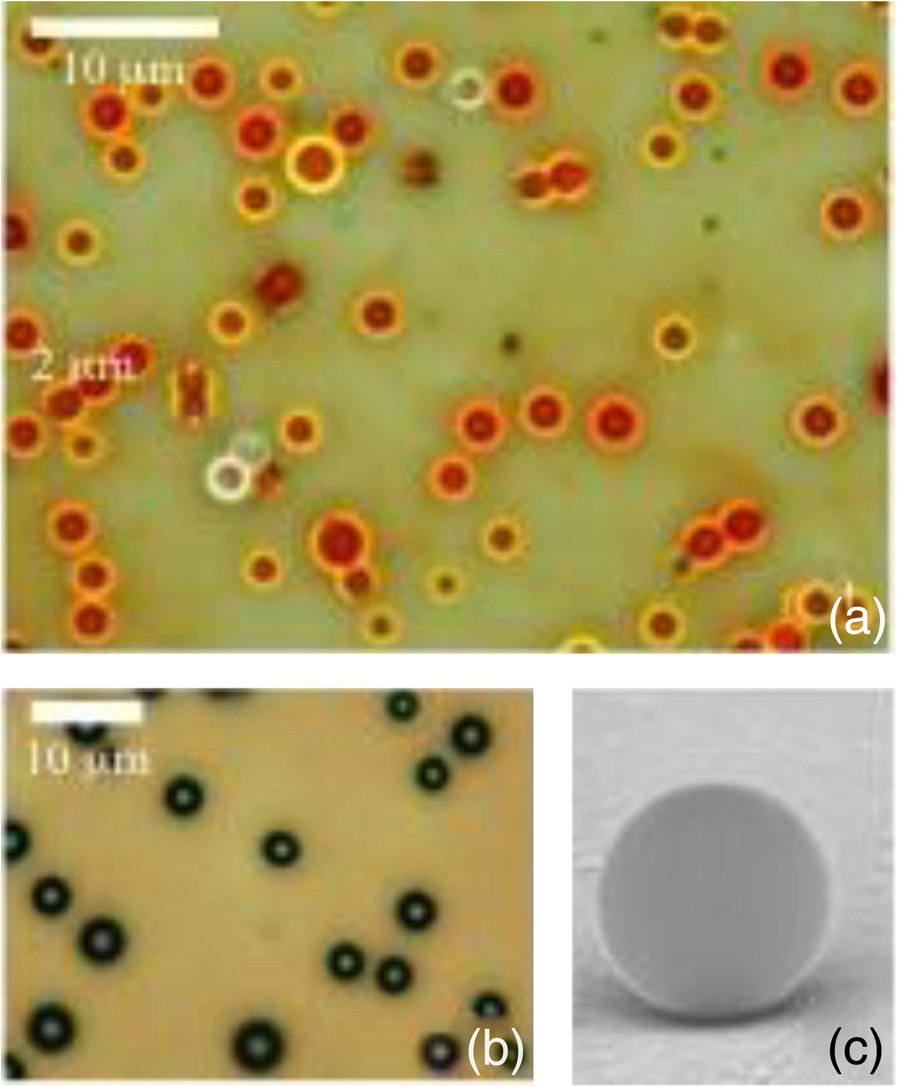
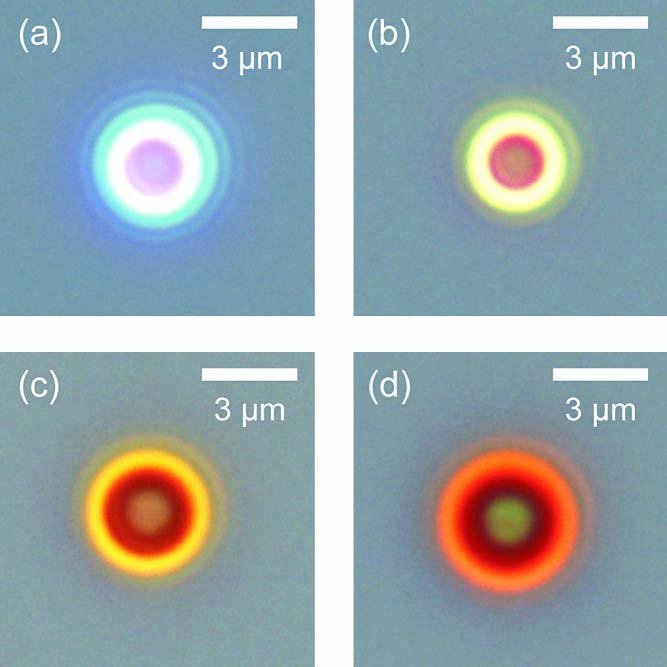
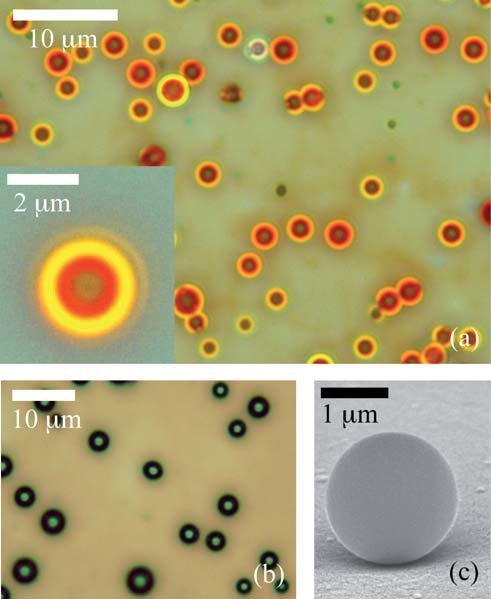
 SetupsIndividual spheres are inspected at 1000× magnification in reflection and transmission before their spectra are recorded. Figure 5 places optical micrographs beside the corresponding transmission and photoluminescence data, allowing diameter and appearance to be checked against the spectral barcode rather than analysing an ensemble average.
 ChemistryThe particles are grown by chemical-vapour decomposition of disilane, and decomposition time controls their internal state. The optical cavity is therefore linked directly to the gas-phase growth history.