Research · Publication & note

Intermode reactive coupling induced by waveguide-resonator interaction

Research publication featured image
JOURNAL ARTICLE
M. Ghulinyan, F. Ramiro-Manzano, N. Prtljaga, M. Bernard, L. Pavesi, G. Pucker and I. Carusotto
Physical Review A 90 · 053811 · 2014
Abstract
We report on a joint theoretical and experimental study of an integrated photonic device consisting of a single-mode waveguide vertically coupled to a disk-shaped microresonator. Starting from the general theory of open systems, we show how the presence of a neighboring waveguide induces a reactive intermode coupling in the resonator, analogous to an off-diagonal Lamb shift in atomic physics. Observable consequences of this coupling manifest as peculiar Fano line shapes in the waveguide transmission spectra. The theoretical predictions are validated by full vectorial three-dimensional finite-element numerical simulations and are confirmed by the experiments.
Figures
Figure 1. Microphotonic device, radial mode families and waveguide-induced frequency shifts.
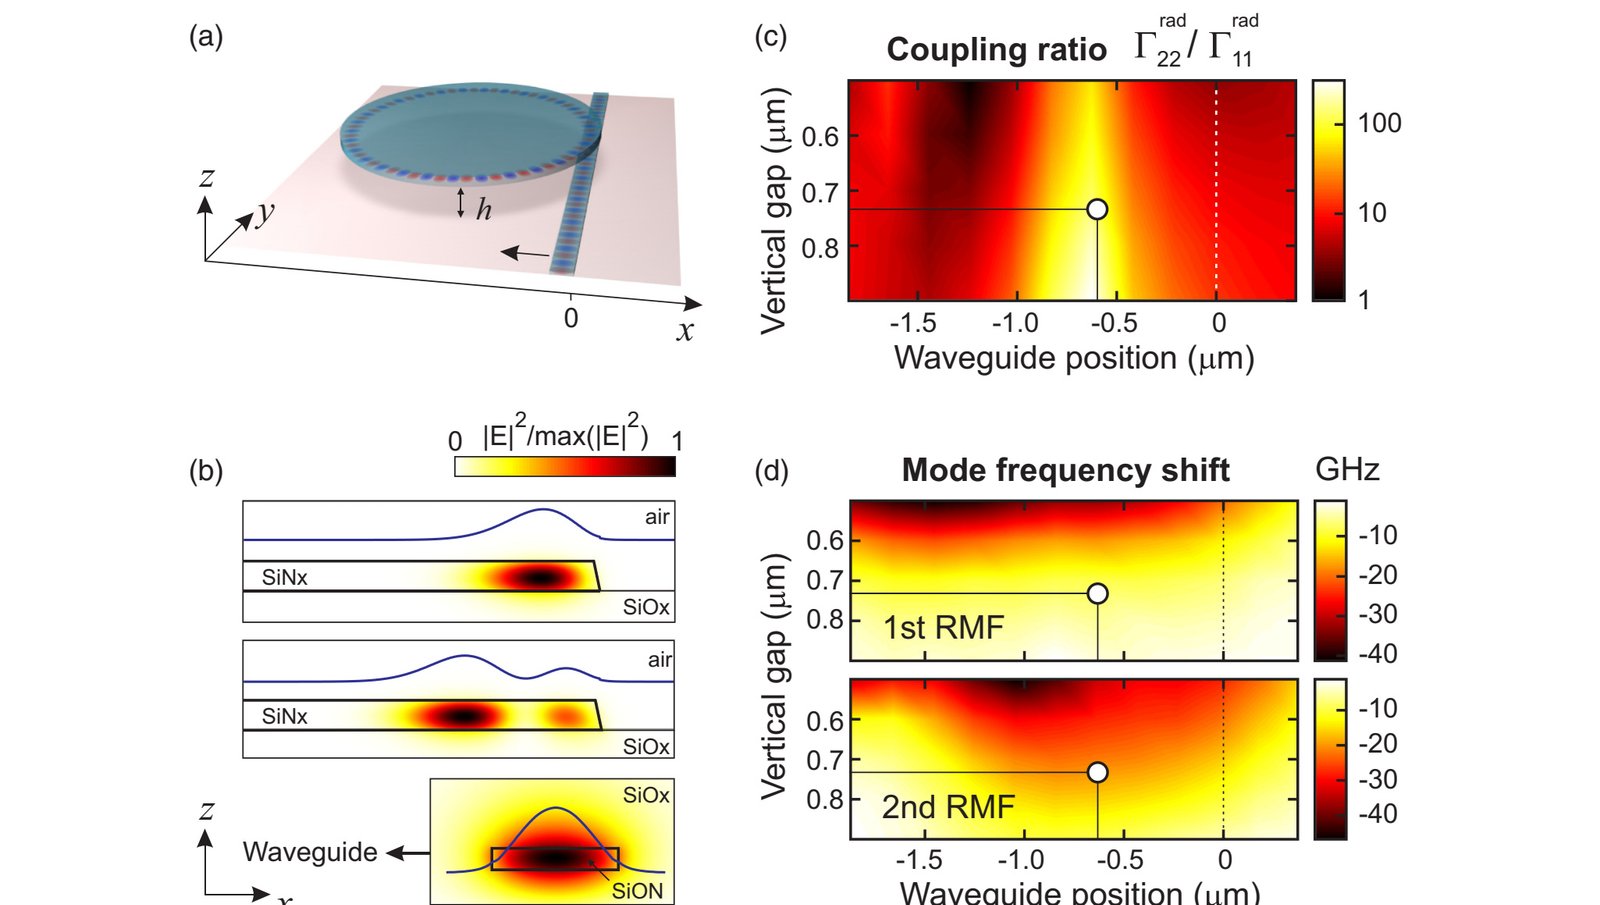
Figure 1. (Color online) (a) A sketch of the microphotonic device. (b) The intensity profile of the first and second radial mode families (RMFs) of the resonator (top and middle panels) and of the waveguide mode (bottom panel). The blue curves show the cuts of the intensity profile, and the labels indicate the different materials. (c), (d) Results of ab initio numerical calculations for (c) the radiative decay rate ratio Γ₂₂ʳᵃᵈ/Γ₁₁ʳᵃᵈ and (d) the frequency shifts of the first (Γ₁₁, top) and the second (Γ₂₂, bottom) radial family modes as functions of the waveguide position. The open circles indicate the waveguide position for the fabricated 40-μm-diameter resonator.

From M. Ghulinyan et al., Physical Review A 90, 053811 (2014), DOI 10.1103/PhysRevA.90.053811. © 2014 American Physical Society. Reproduced under APS author reuse rights.
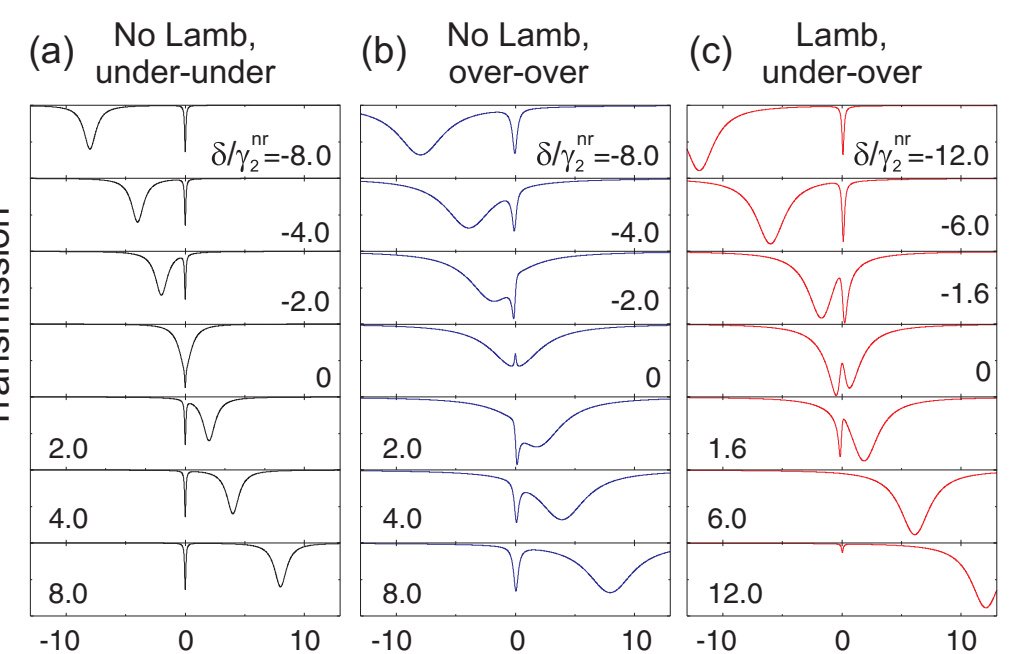
Figure 2. Calculated transmission spectra for several coupling regimes and detunings.
Figure 2. (Color online) Analytically calculated transmission spectra in different regimes and for different detunings δ = ω₂ − ω₁. (a) Both modes are undercoupled, Γ₁₁,₂₂ʳᵃᵈ/γ₁,₂ⁿʳ = 0.25 and Γ₁₂ = 0. (b) Both modes are overcoupled, Γ₁₁,₂₂ʳᵃᵈ/γ₁,₂ⁿʳ = 4 and Γ₁₂ = 0. (c) Narrow (broad) mode is undercoupled (overcoupled), Γ₁₁ʳᵃᵈ/γ₁ⁿʳ = 0.125 (Γ₂₂ʳᵃᵈ/γ₂ⁿʳ = 2) and Γ₁₂/γ₂ⁿʳ = 0.6. The ratio γ₁ⁿʳ/γ₂ⁿʳ = 0.1 in (a)–(b) and 0.16 in (c).

From M. Ghulinyan et al., Physical Review A 90, 053811 (2014), DOI 10.1103/PhysRevA.90.053811. © 2014 American Physical Society. Reproduced under APS author reuse rights.
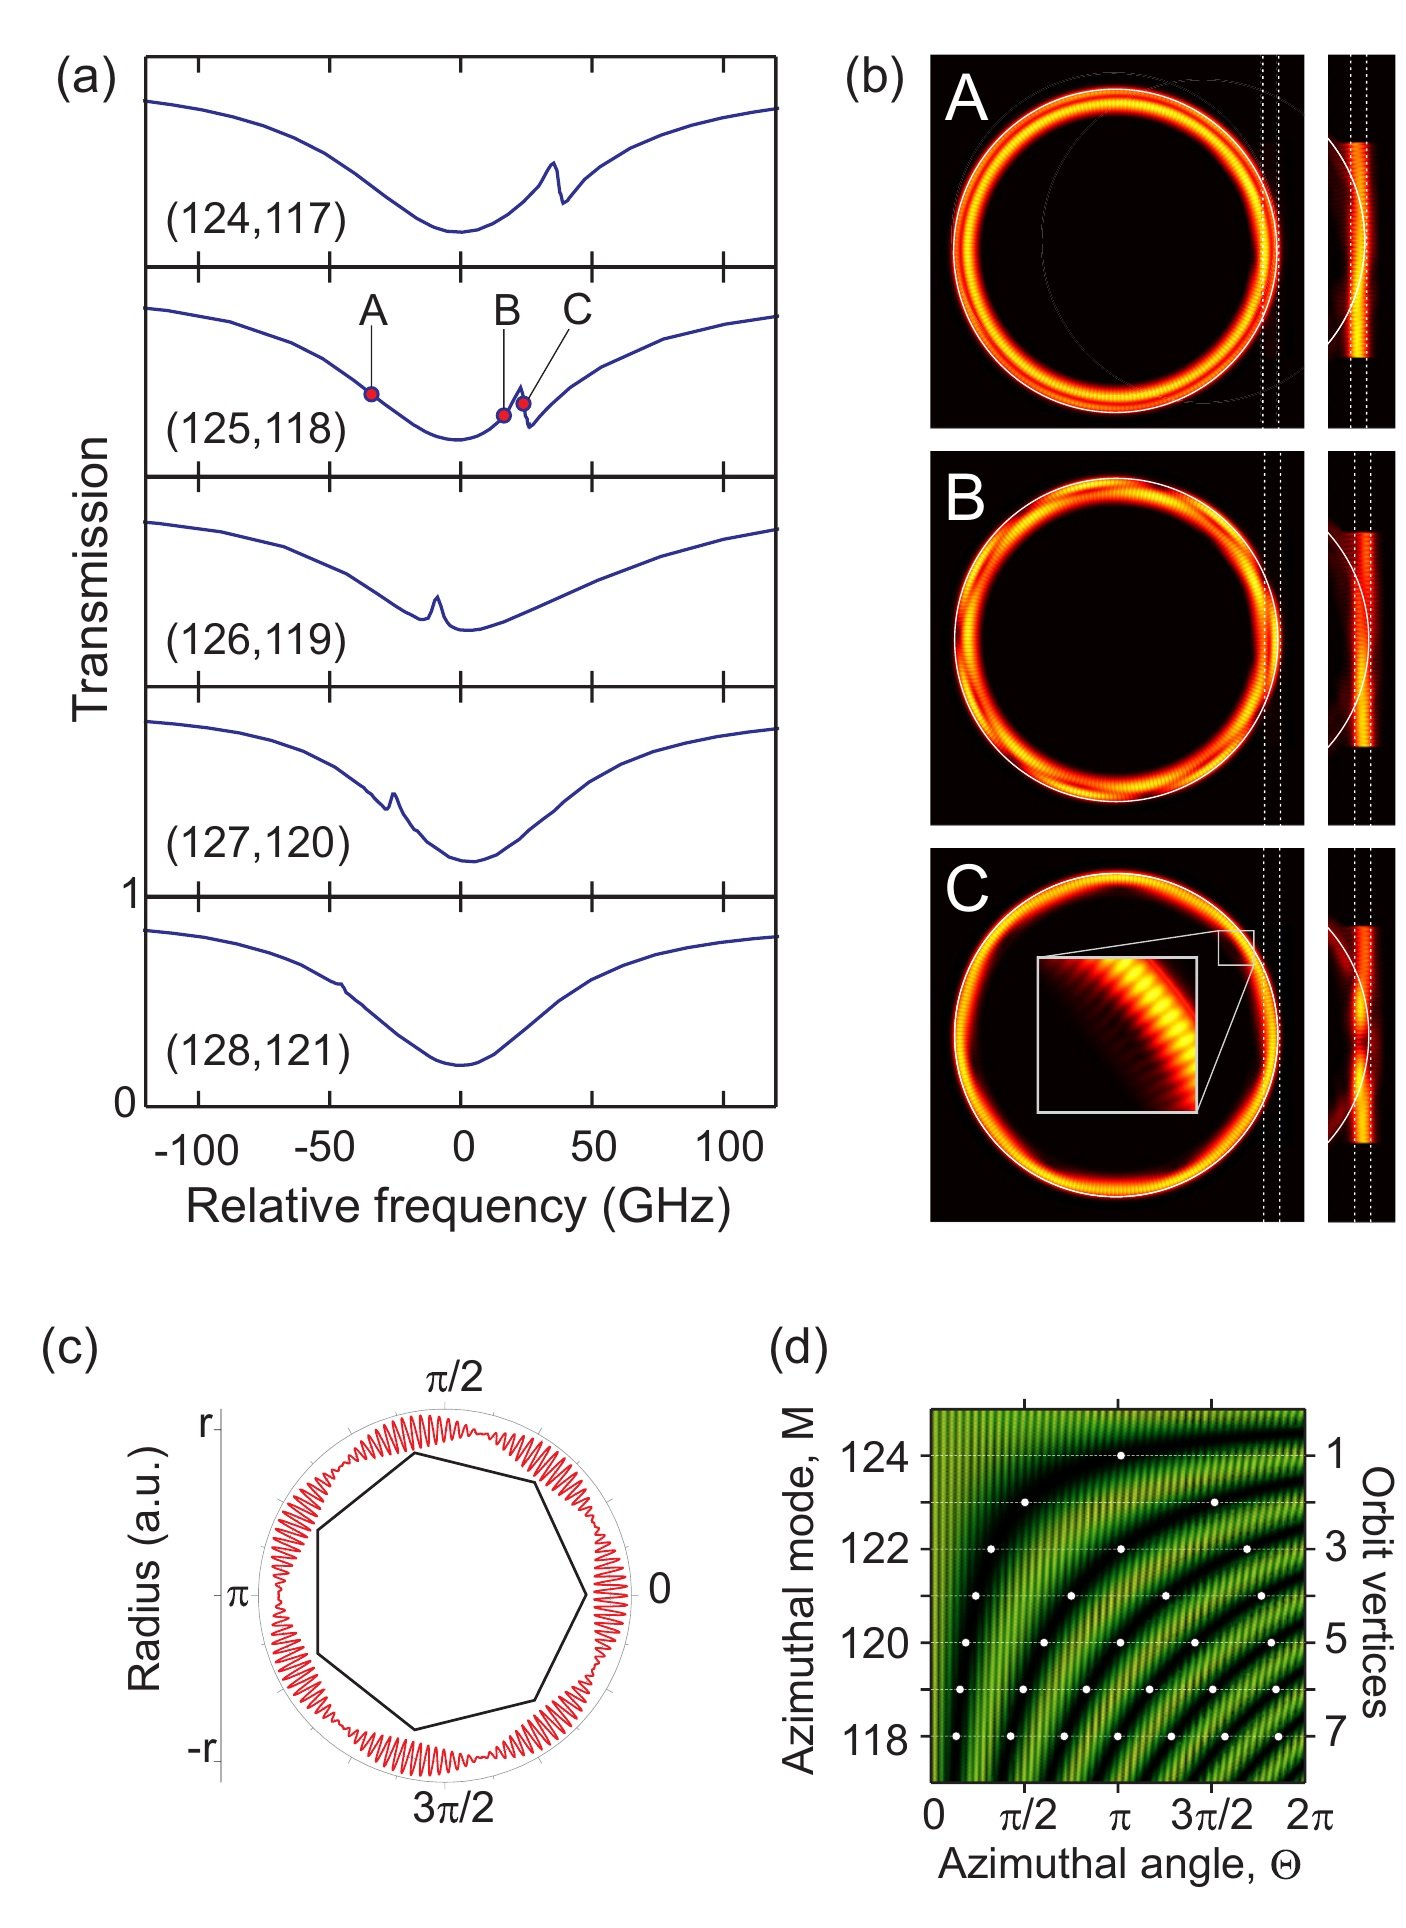
Figure 3. Numerically calculated spectra and modal interference patterns.
Figure 3. (Color online) (a) Numerically calculated spectra for different detunings between the two radial family modes. The azimuthal mode order of the two resonances is reported in each graph. (b) Planar cuts of the intensity profile inside the resonator and inside the waveguide at the frequencies indicated as A, B, and C in (a). (c) The polygonal shape of the spatially oscillating mode profile is explained via an interference between the fields E₁ = E₁⁰ cos(θM₁) and E₂ = E₂⁰ cos(θM₂) of two modes with different azimuthal mode numbers M₁ and M₂. (d) This interference pattern is illustrated as a function of the azimuthal angle θ and the number M₂ of the second-order radial mode for a fixed M₁ = 125 of the first-order radial mode: as expected, the number of polygon vertices is determined by the difference |M₂ − M₁|.

From M. Ghulinyan et al., Physical Review A 90, 053811 (2014), DOI 10.1103/PhysRevA.90.053811. © 2014 American Physical Society. Reproduced under APS author reuse rights.
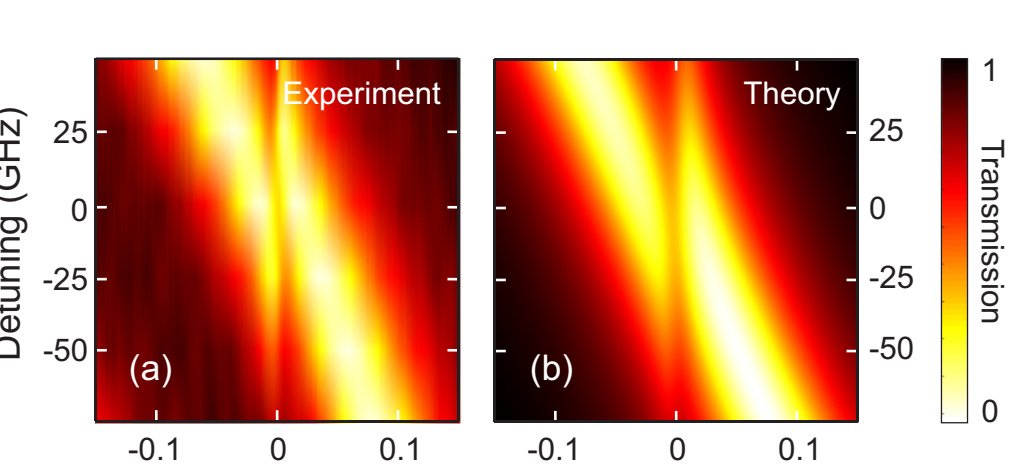
Figure 4. Fabricated microresonator and measured transmission spectra.
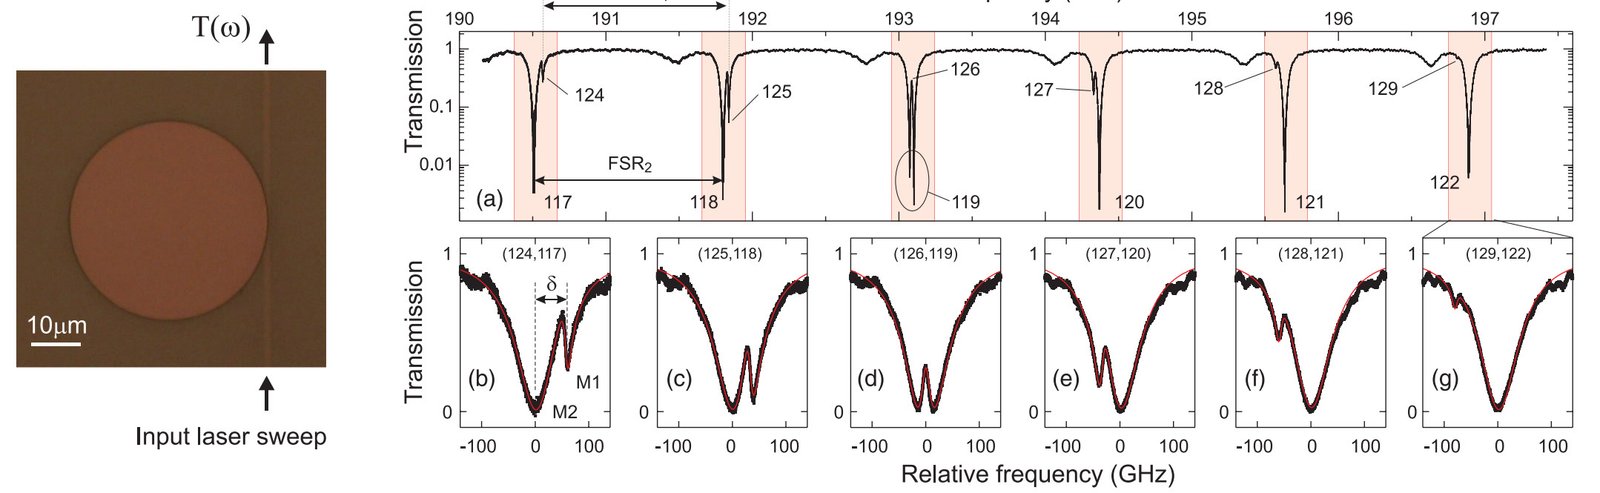
Figure 4. (Color online) (Left) An optical photograph of the fabricated 40-μm-diameter microresonator and (a) the measured transmission spectrum as a function of the absolute incident frequency. The azimuthal mode numbers M₁ and M₂ are indicated next to the different first- and second-order radial modes. The two modal families have slightly different free spectral ranges of FSR₁ ≈ 1.236 THz and FSR₂ ≈ 1.256 THz. (b)–(g) Blow-ups of the regions marked in gray in (a). In each panel, the relative frequency is measured from the broader second family resonance. Red lines show fits to the spectra using the analytical model.

From M. Ghulinyan et al., Physical Review A 90, 053811 (2014), DOI 10.1103/PhysRevA.90.053811. © 2014 American Physical Society. Reproduced under APS author reuse rights.
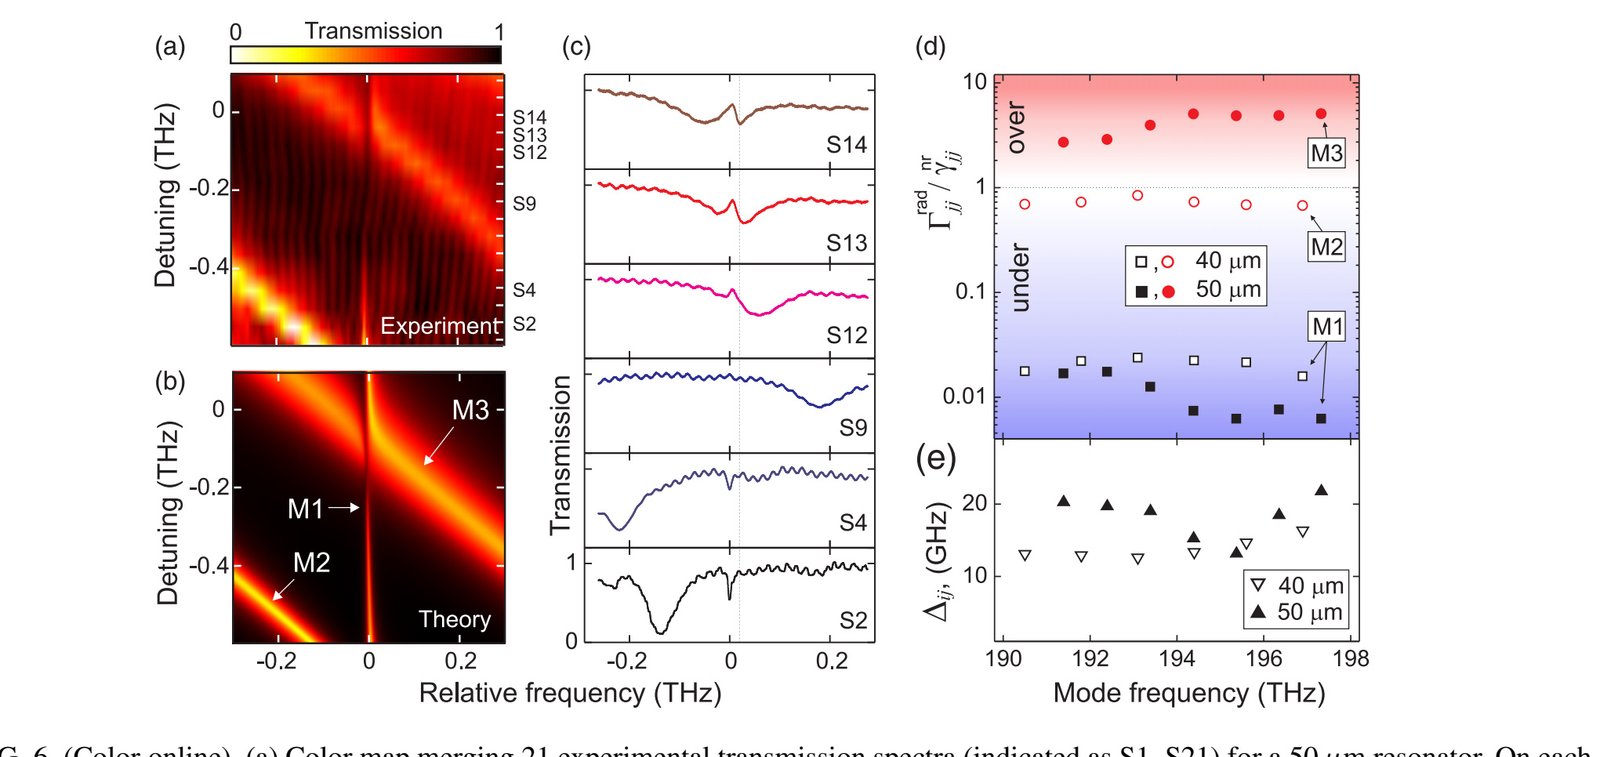
Figure 5. Experimental and analytical transmission spectra for the 40 micrometre resonator.
Figure 5. (Color online) (a) Color-map plot merging six experimental transmission spectra of the 40 μm resonator, shown in Figs. 4(b)–4(g). (b) Color-map plot of the analytical prediction for the transmittivity of a two-mode cavity using globally optimized parameters.

From M. Ghulinyan et al., Physical Review A 90, 053811 (2014), DOI 10.1103/PhysRevA.90.053811. © 2014 American Physical Society. Reproduced under APS author reuse rights.
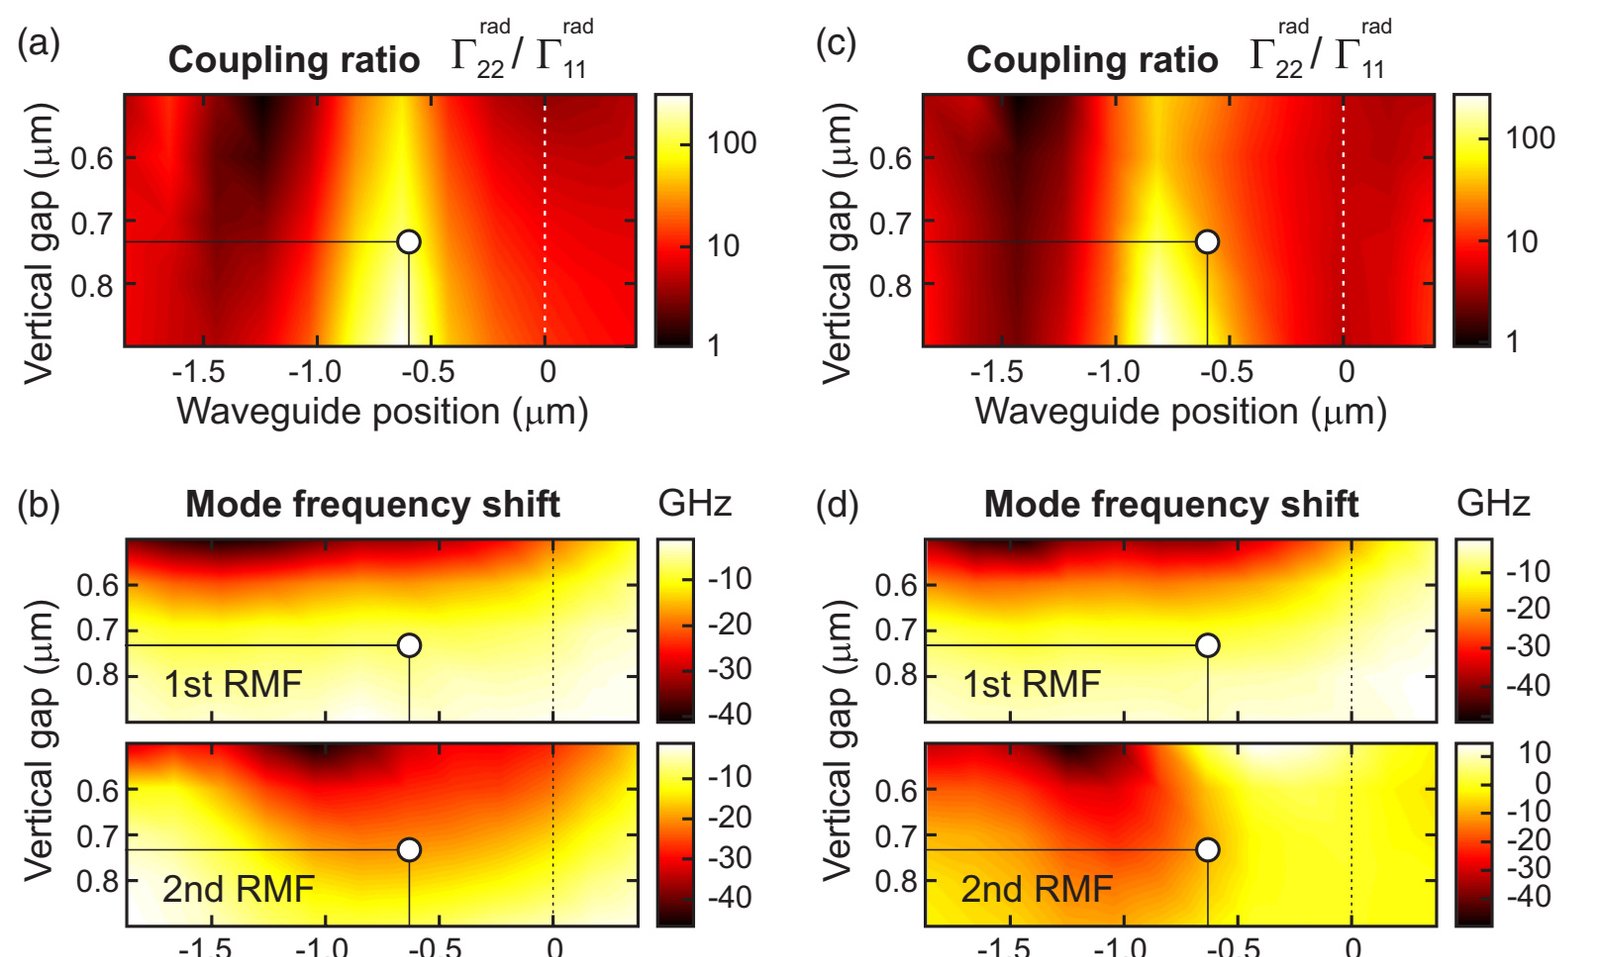
Figure 6. Experimental and analytical transmission spectra for the 50 micrometre resonator.
Figure 6. (Color online) (a) Color map merging 21 experimental transmission spectra (indicated as S1–S21) for a 50 μm resonator. On each row, the relative frequency is measured from the narrow mode frequency. (b) Analytic prediction for T(ω) using a three-mode extension of the model with optimized global parameters. (c) Selected examples of spectra. (d), (e) System parameters obtained by independently fitting each experimental spectrum with the analytical model.

From M. Ghulinyan et al., Physical Review A 90, 053811 (2014), DOI 10.1103/PhysRevA.90.053811. © 2014 American Physical Society. Reproduced under APS author reuse rights.

Figure 7. Simulated decay-rate ratios and frequency shifts of resonator modes.
Figure 7. (Color online) Ratio of the decay rates and frequency shift of the resonator modes as obtained from finite-element simulations. In the left (a), (b) panels [the same plots as in Fig. 1(a)], the different radial family modes are well detuned from each other and effectively independent. In the right (c), (d) panels, the considered modes are mixed by the off-diagonal reactive and dissipative coupling terms.

From M. Ghulinyan et al., Physical Review A 90, 053811 (2014), DOI 10.1103/PhysRevA.90.053811. © 2014 American Physical Society. Reproduced under APS author reuse rights.

How to cite
Article access and reuse
APS grants authors the right to place all or part of an article, including the unchanged APS-prepared version, on the author’s personal website when no fee is charged and the APS copyright notice is retained. The seven complete figures above are reproduced without modification from that APS-prepared article, with the full bibliographic citation and APS copyright notice retained.

Research fields

Top-down

A single-mode buried waveguide is vertically coupled to a lithographically defined microdisk that supports several radial mode families. Controlled alignment and gap make the waveguide part of the resonator's open electromagnetic environment rather than merely an input port.

Simulations & fits

Open-system coupled-mode theory identifies an off-diagonal reactive shift induced by the neighbouring waveguide. Full-vector three-dimensional finite-element simulations and multimode analytical fits reproduce the measured Fano line shapes and distinguish reactive intermode coupling from dissipative leakage.

Characterization

Large sets of high-resolution transmission spectra follow neighbouring radial families across frequency and device geometries. Their evolving asymmetry and avoided behaviour provide the experimental signature of the waveguide-induced coupling predicted by the model.

RESEARCH TOPICS
CouplingThe buried waveguide is not merely an access port: its evanescent field modifies the resonance frequencies of two radial-mode families and couples them reactively through their shared interaction region. Figure 1 maps the frequency shifts and relative radiative coupling as vertical gap and lateral position change. Maximum loading occurs when the waveguide overlaps a radial lobe, but the associated frequency shift follows a different dependence. This distinction makes it possible to separate dissipative loading from the waveguide-induced optical analogue of a Lamb shift.InterferenceWhen a narrow and a broad radial resonance overlap, their waveguide-mediated amplitudes interfere and create a Fano feature. The feature's strength and asymmetry are governed by the modulus and phase of a complex coefficient, not only by the cold-cavity detuning. Figures 2–4 show under/overcoupled combinations, sign reversals and a small detuning interval where the narrow line disappears completely. The disappearance is destructive interference in the common output channel, not the physical loss of the intracavity mode.MultimodeFirst- and second-order radial families carry different azimuthal numbers and field maxima. Their coherent superposition produces polygonal intracavity intensity patterns; in Figure 3 the number of vertices follows |M2 − M1|. The waveguide selects the relative excitation of these families through its position under the disk. This gives a direct spatial interpretation of the spectral Fano response and shows how a nominally simple whispering-gallery resonator can host structured intermode dynamics.ResonatorsGeneralised input–output theory is used for a multimode cavity rather than fitting each resonance independently. It includes intrinsic loss, radiative loading, direct excitation and reactive frequency shifts induced by the nearby guide. The model reproduces measured line shapes across crossings and predicts when ordinary under-, critical- or overcoupling language is insufficient. The result is important for high-Q integrated resonators because the component used to interrogate the cavity can also reshape its modal spectrum.