Research · Publication & note
Complete Crossing of Fano Resonances in an Optical Microcavity via Nonlinear Tuning - Notes
Journal article
Published abstract
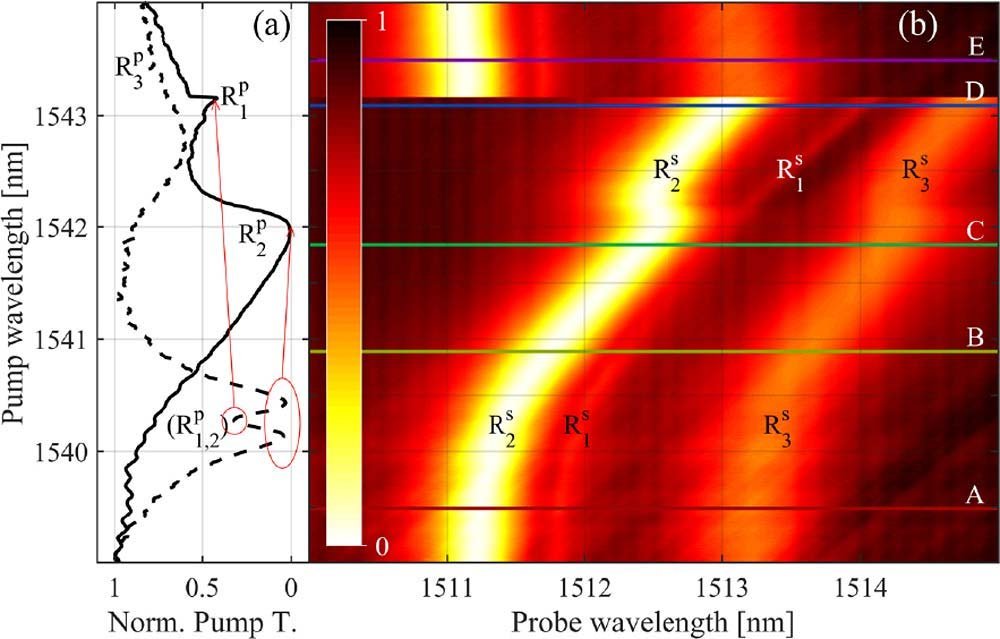
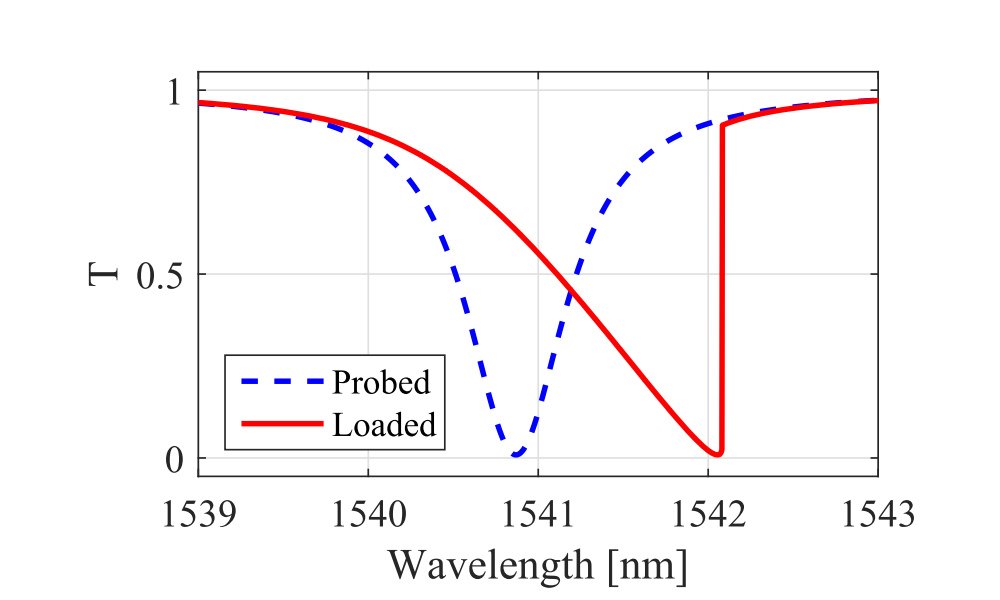
We report on the modeling, simulation, and experimental demonstration of complete mode crossings of Fano resonances within chip-integrated microresonators. The continuous reshaping of resonant lineshapes is achieved via nonlinear thermo-optical tuning when the cavity-coupled optical pump is partially absorbed by the material. The locally generated heat then produces a thermal field, which influences the spatially overlapping optical modes, allowing us to alter the relative spectral separation of resonances. Furthermore, we exploit such tunability to continuously probe the coupling between different families of quasi-degenerate modes that exhibit asymmetric Fano interactions. As a particular case, we demonstrate a complete disappearance of one of the modal features in the transmission spectrum as predicted by Fano [Phys. Rev. 124, 1866 (1961)]. The phenomenon is modeled as a third-order nonlinearity with a spatial distribution that depends on the stored optical field and thermal diffusion within the resonator. The performed nonlinear numerical simulations are in excellent agreement with the experimental results, which confirm the validity of the developed theory.
Figures
© 2017 Chinese Laser Press. Source: M. Bernard et al., Photonics Research 5(3), 168-175 (2017), DOI 10.1364/PRJ.5.000168. Reproduced on the author’s personal website under the rights retained in the journal’s copyright transfer agreement.
© 2017 Chinese Laser Press. Source: M. Bernard et al., Photonics Research 5(3), 168-175 (2017), DOI 10.1364/PRJ.5.000168. Reproduced on the author’s personal website under the rights retained in the journal’s copyright transfer agreement.
© 2017 Chinese Laser Press. Source: M. Bernard et al., Photonics Research 5(3), 168-175 (2017), DOI 10.1364/PRJ.5.000168. Reproduced on the author’s personal website under the rights retained in the journal’s copyright transfer agreement.
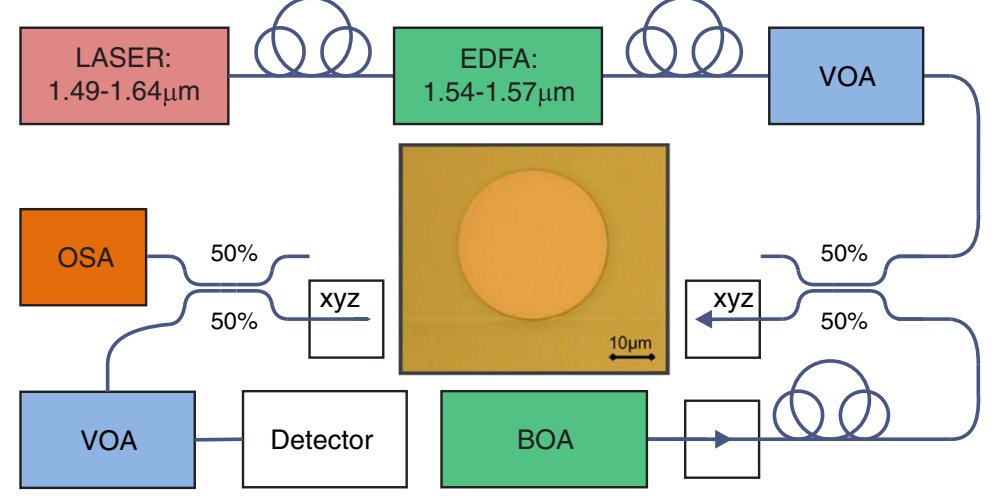
© 2017 Chinese Laser Press. Source: M. Bernard et al., Photonics Research 5(3), 168-175 (2017), DOI 10.1364/PRJ.5.000168. Reproduced on the author’s personal website under the rights retained in the journal’s copyright transfer agreement.
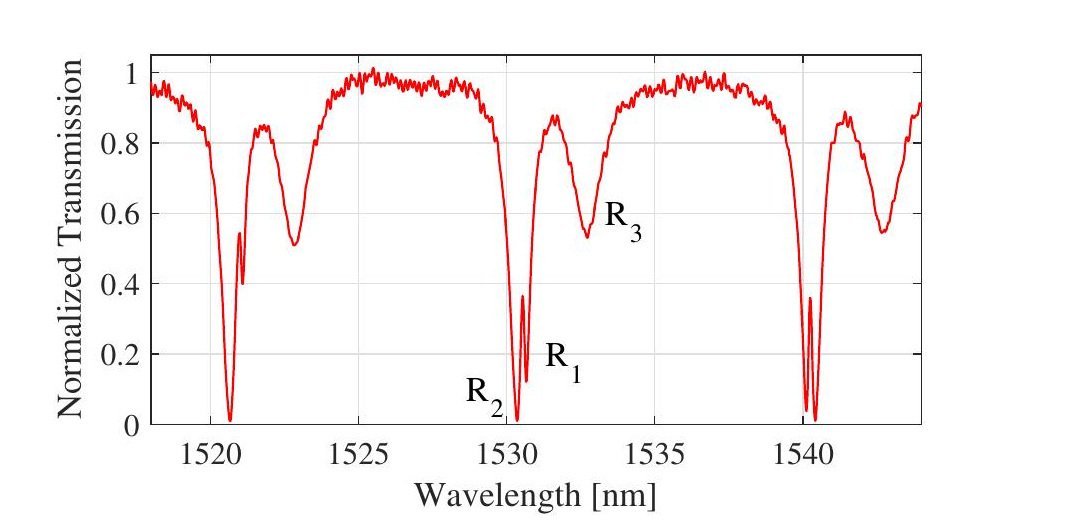
© 2017 Chinese Laser Press. Source: M. Bernard et al., Photonics Research 5(3), 168-175 (2017), DOI 10.1364/PRJ.5.000168. Reproduced on the author’s personal website under the rights retained in the journal’s copyright transfer agreement.
© 2017 Chinese Laser Press. Source: M. Bernard et al., Photonics Research 5(3), 168-175 (2017), DOI 10.1364/PRJ.5.000168. Reproduced on the author’s personal website under the rights retained in the journal’s copyright transfer agreement.
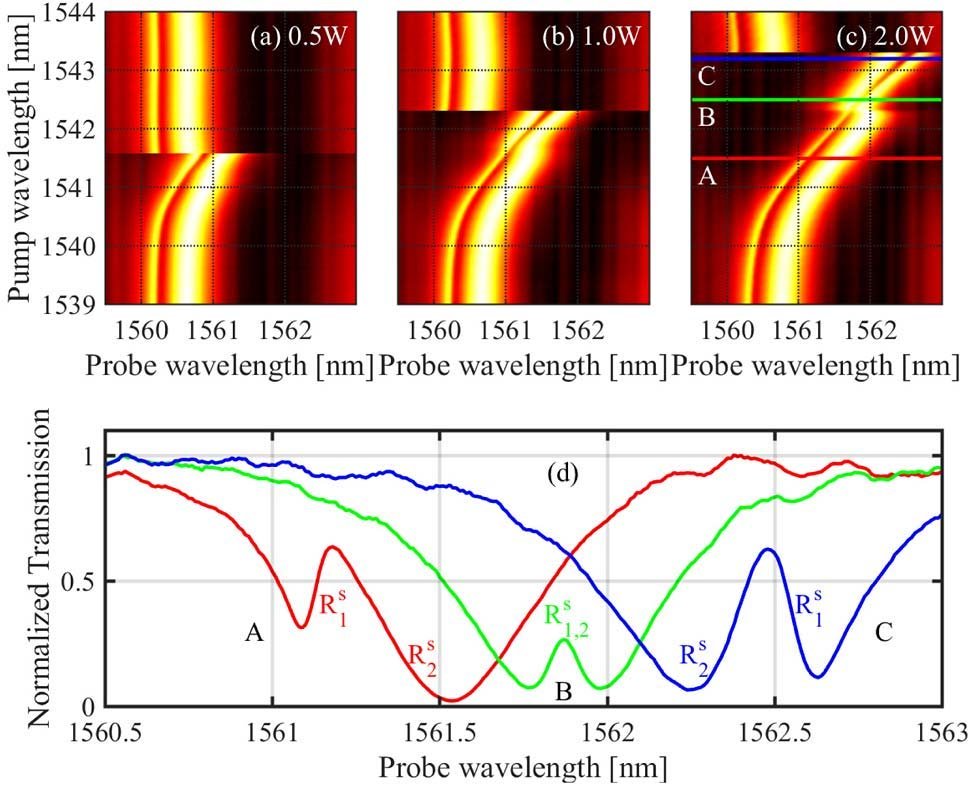
© 2017 Chinese Laser Press. Source: M. Bernard et al., Photonics Research 5(3), 168-175 (2017), DOI 10.1364/PRJ.5.000168. Reproduced on the author’s personal website under the rights retained in the journal’s copyright transfer agreement.
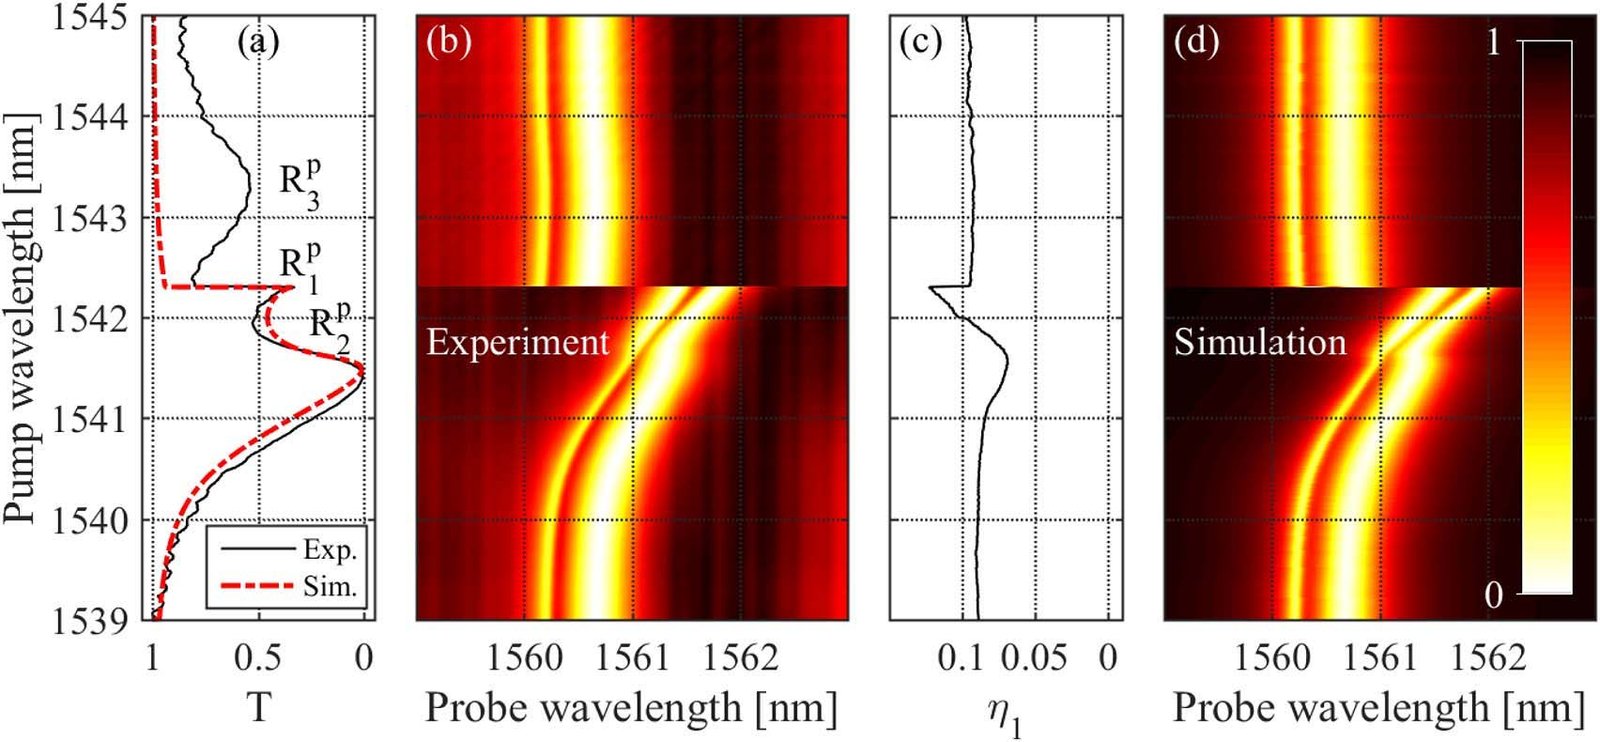
© 2017 Chinese Laser Press. Source: M. Bernard et al., Photonics Research 5(3), 168-175 (2017), DOI 10.1364/PRJ.5.000168. Reproduced on the author’s personal website under the rights retained in the journal’s copyright transfer agreement.
How to cite
Article access and reuse
The Version of Record is openly available from the journal. The Photonics Research copyright transfer agreement permits authors to reuse all or part of the work, including the publisher-formatted version, on their personal web homepage when the Chinese Laser Press copyright notice is retained. The figures below are the complete original compositions extracted from the article PDF and are reproduced with that notice.
Related publications

Research fields
Top-down
An integrated microcavity supporting overlapping radial mode families is used as a controllable Fano system. Its patterned resonator-waveguide geometry allows selected cavity resonances to be addressed without globally retuning the entire photonic circuit.
Simulations & fits
Coupled-mode equations include absorption-induced heating and the different spatial overlap of each optical mode with the thermal field. The model and thermal simulations explain how nonlinear tuning carries two Fano resonances through a complete crossing.
Characterization
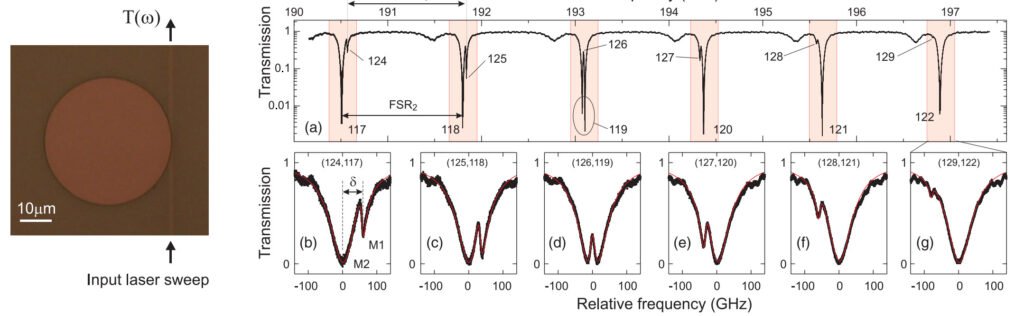
Pump-power-dependent transmission spectra track the continuous reshaping, suppression and reappearance of the resonances. Simultaneous broadband and tunable-laser measurements distinguish genuine mode interaction from an apparent crossing caused only by line-shape asymmetry.
RESEARCH TOPICS
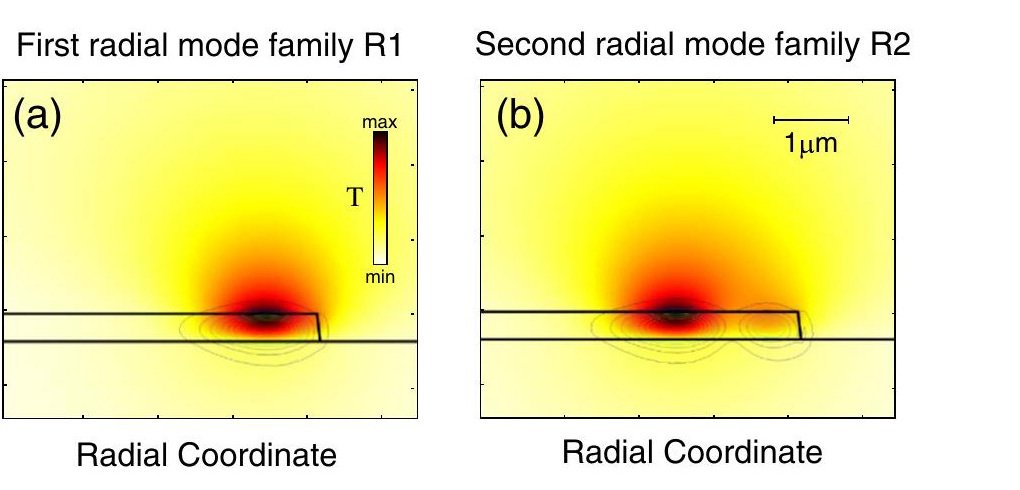
 CouplingThe relative weights depend on where the waveguide lies under the radial field lobes; moving it inward can even make the second family couple more strongly than the fundamental. The coupled-mode model uses these independently determined weights, radiative rates and detuning to explain why a narrow resonance can be suppressed or enhanced by a broader neighbour rather than assigning every line-shape change to heating.
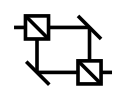 InterferenceWhen resonances from two radial families approach, their excitation pathways interfere. The transmission spectrum therefore records coherent interference between families, not simply the sum of two Lorentzian dips.
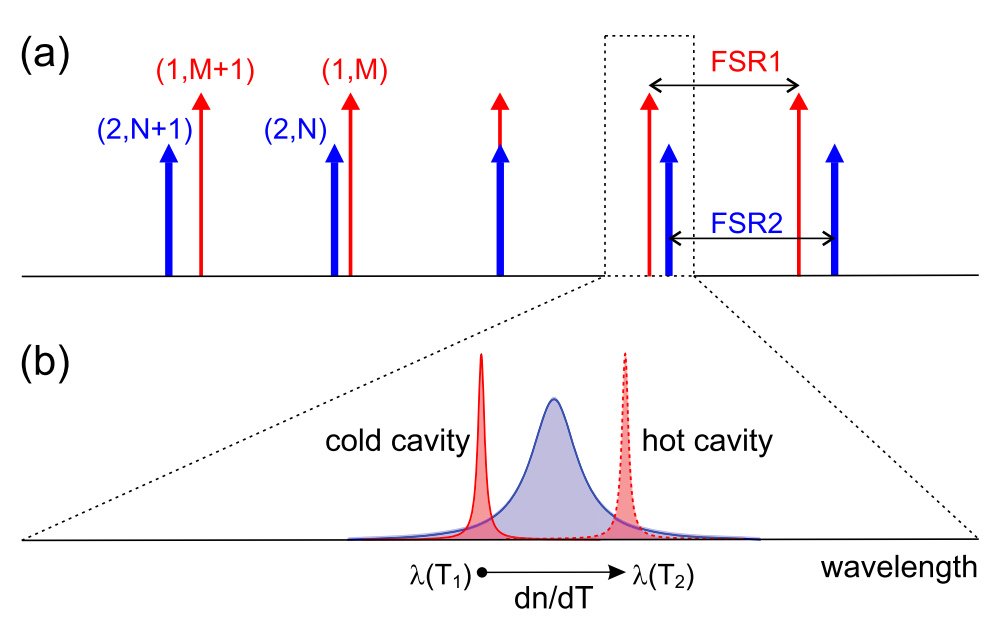
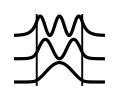 MultimodeBecause the two combs are slightly mismatched, selected members repeatedly approach and cross across the measured wavelength range. FEM field profiles and thermal simulations show that the two radial orders deposit heat in different regions, which changes how efficiently a pumped mode shifts its neighbour.
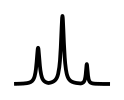 NonlinearA strong pump changes the refractive index primarily through absorption-induced heating and shifts a selected cavity resonance. The nonlinear effect is used as a tuning mechanism for coherent multimode interference rather than reported only as bistability of a single resonance.
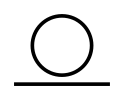 ResonatorsTheir different linewidths and thermal overlaps provide the asymmetry needed for pronounced Fano features. The study shows that a single high-Q cavity can be treated as an interacting set of modal families, enabling spectral reconfiguration without fabricating two separate resonators.