Research · Publication & note
Photonic crystals for applications in photoelectrochemical processes: Photoelectrochemical solar cells with inverse opal topology - Notes
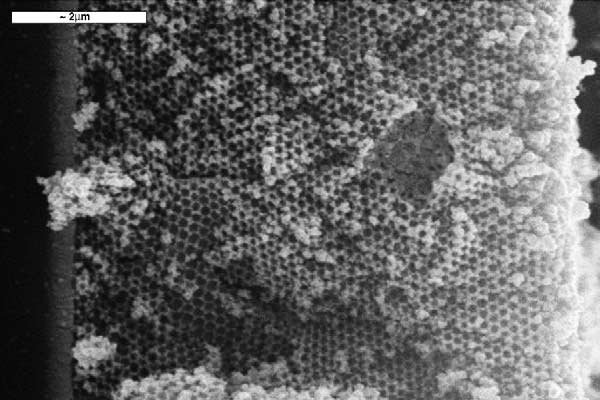
Research publication
Published abstract
Photonic crystal structures, that present strong light localization effects near photonic band gap frequency regions, can be very useful to maximize chemical processes of phototoactive materials. One example is the use of photonic crystals to improve solar energy harvesting in photoelectrochemical solar cells. Here, we describe the optical monitoring synthesis of macroporous materials, with inverse opal topology, made of transition metal and rare-earth oxide nanoparticles. Through the optical properties we can obtain information concerning both infiltration and over layer growth. Finally, we report on the efficiency improvement of photoelectrochemical cells when titania inverse opal topology is used.
Figures
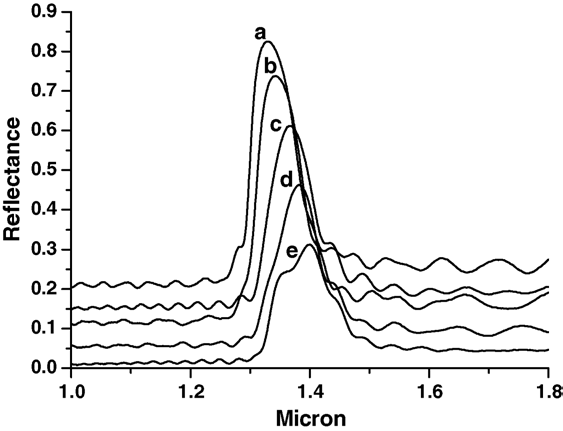
Source: I. Rodriguez et al., Photonics Nanostruct. Fundam. Appl. 3, 148-154 (2005). © Elsevier B.V.
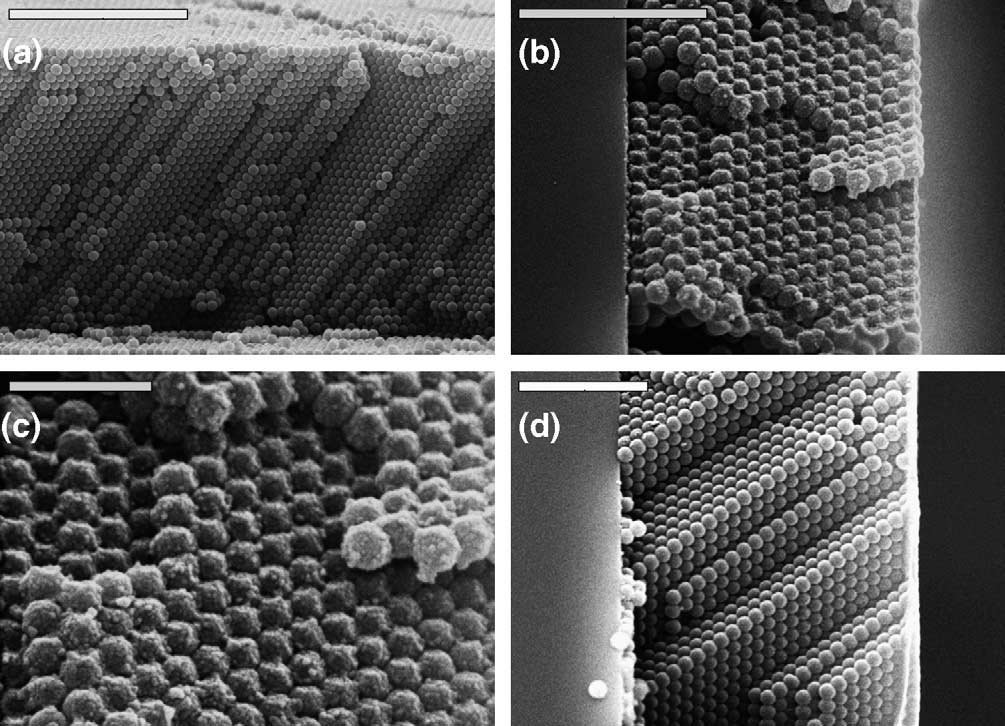
Source: I. Rodriguez et al., Photonics Nanostruct. Fundam. Appl. 3, 148-154 (2005). © Elsevier B.V.
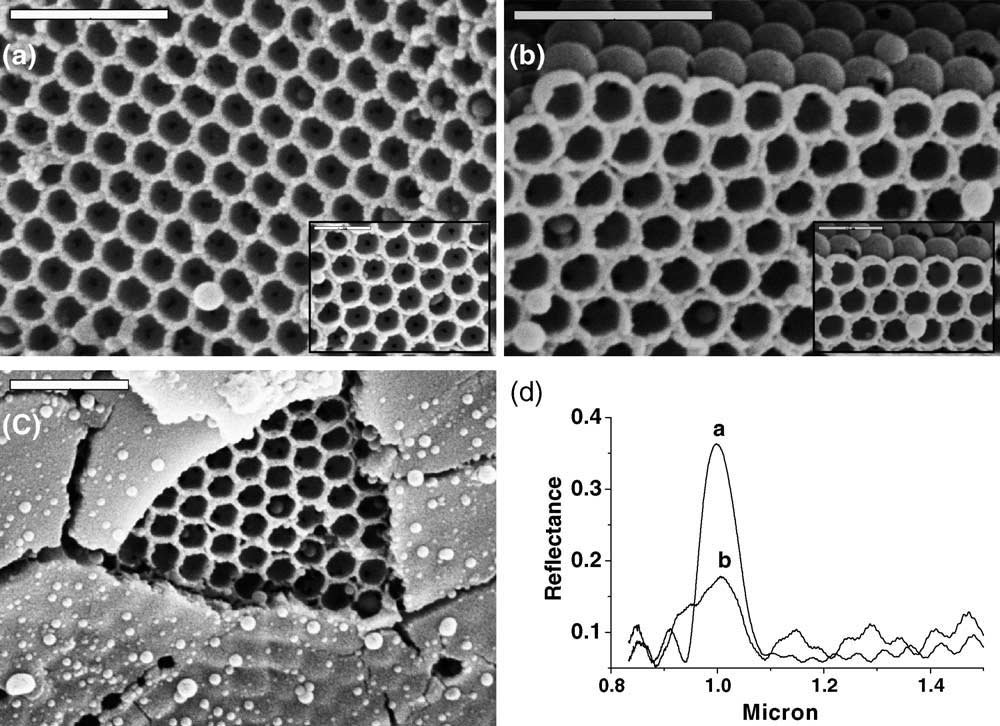
Source: I. Rodriguez et al., Photonics Nanostruct. Fundam. Appl. 3, 148-154 (2005). © Elsevier B.V.
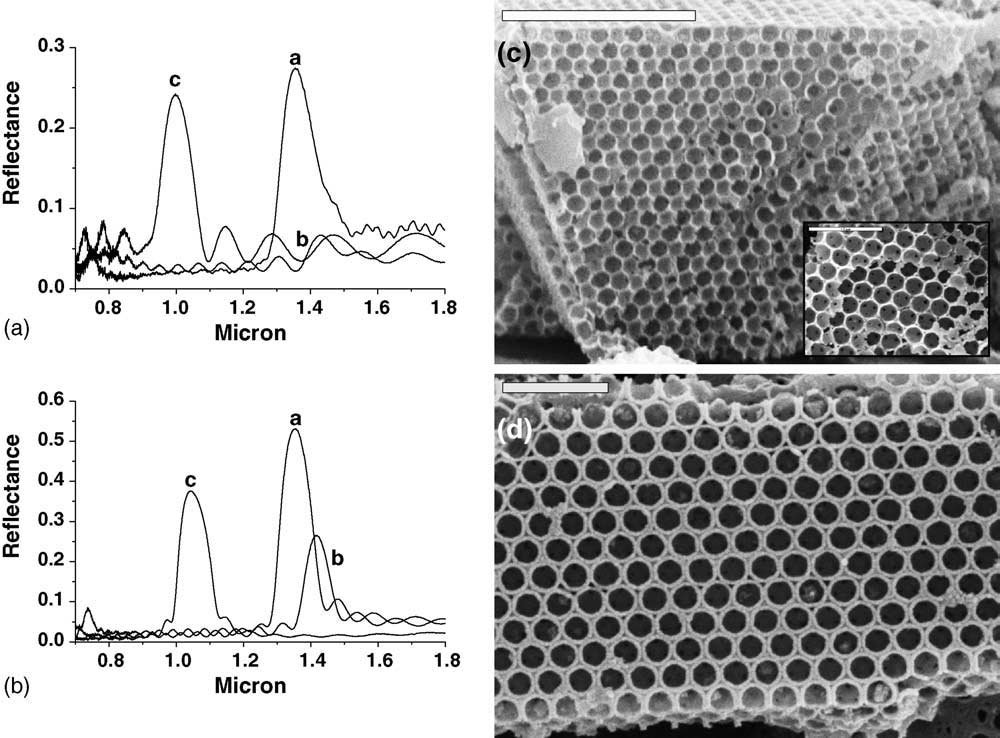
Source: I. Rodriguez et al., Photonics Nanostruct. Fundam. Appl. 3, 148-154 (2005). © Elsevier B.V.
Source: I. Rodriguez et al., Photonics Nanostruct. Fundam. Appl. 3, 148-154 (2005). © Elsevier B.V.
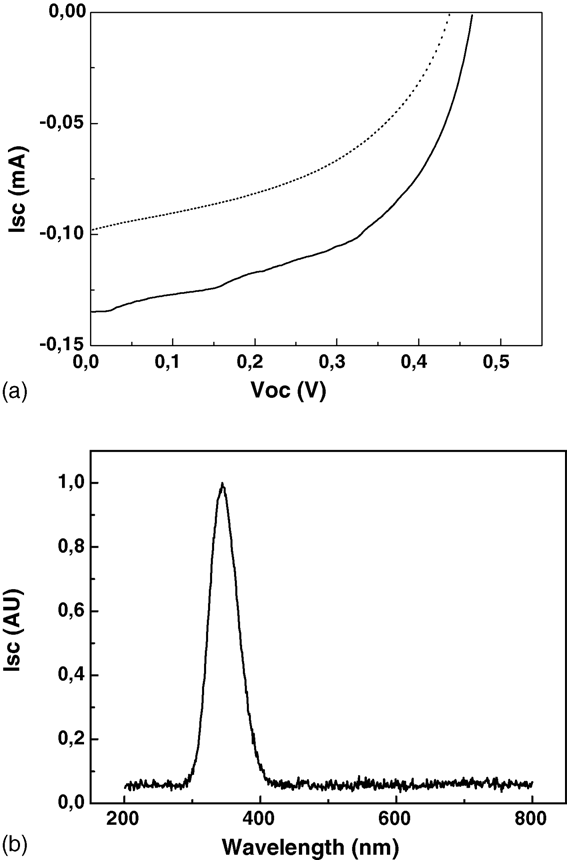
Source: I. Rodriguez et al., Photonics Nanostruct. Fundam. Appl. 3, 148-154 (2005). © Elsevier B.V.
How to cite
Article access and reuse
This is a subscription article. Elsevier's author rights allow authors to reuse their own article material with acknowledgement in personal scholarly contexts. No Version of Record PDF is hosted.
Related publications
Research fields
Bottom-up
Latex opals are infiltrated with TiO₂, CeO₂, ZrO₂ or Y₂O₃ nanoparticles and then removed to leave interconnected inverse-opal frameworks. Repeated infiltration controls wall loading while preserving the three-dimensional macropore topology.
Characterization
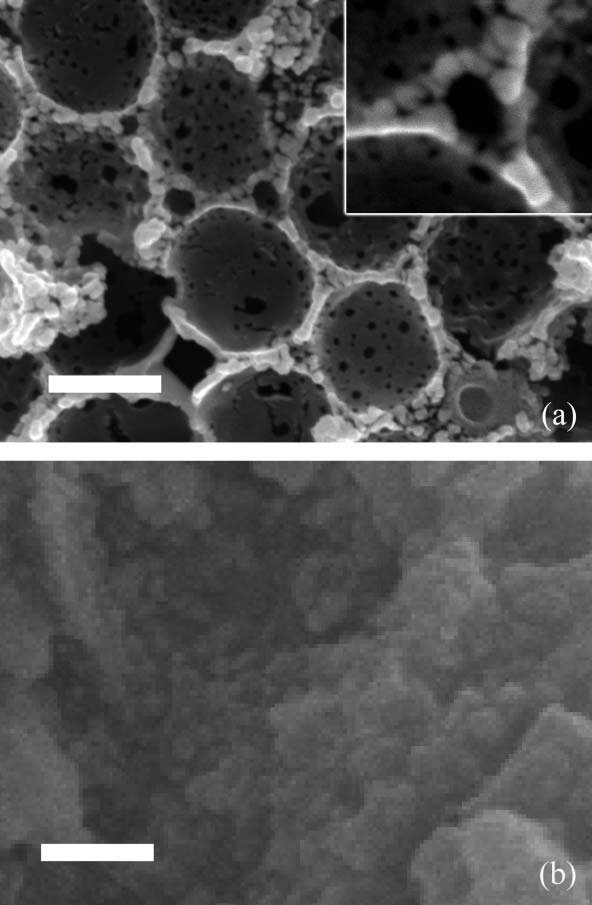
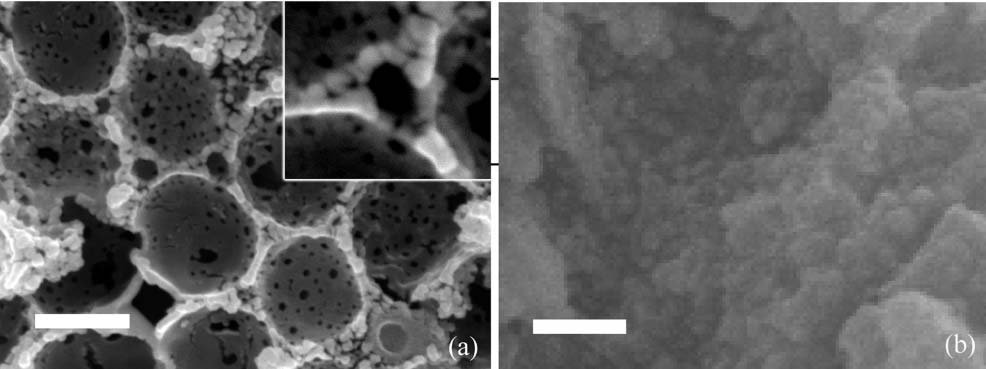
Infrared reflectance follows stop-band shifts during infiltration and template removal, providing a non-destructive measure of how the pores fill. SEM and photoelectrochemical current-voltage tests then connect the completed inverse-opal morphology with improved light harvesting in solar-cell electrodes.
RESEARCH TOPICS
 HarvestingBecause the reference contains roughly four times more active material at the same thickness, the conversion efficiency per unit TiO2 volume is about five times higher for the inverse opal. The result isolates a photonic benefit beyond simply adding more semiconductor.
 InterferenceReflectance therefore provides an in-process monitor of pore filling and overlayer growth before the template is removed. The spectral photocurrent peaks near TiO2's absorption edge, linking the device response to the designed optical structure.
 MaterialsThe connected macropores retain a high internal surface while arranging it periodically, unlike a dense film. Optical monitoring during repeated infiltration cycles helps distinguish successful filling from an unwanted surface overlayer, making structural quality part of the synthesis rather than a post hoc SEM check.
 ChemistryThe same replication strategy is extended to ceria, zirconia and yttria because each oxide brings different photocatalytic or acid-base properties. The study therefore joins sol-gel/precipitation chemistry with optical feedback from the evolving photonic crystal.