Research · Publication & note
Single Crystal Growth of Hybrid Lead Bromide Perovskites Using a Spin-Coating Method - Notes
ACS Omega · Journal article · 15 May 2018
Published abstract
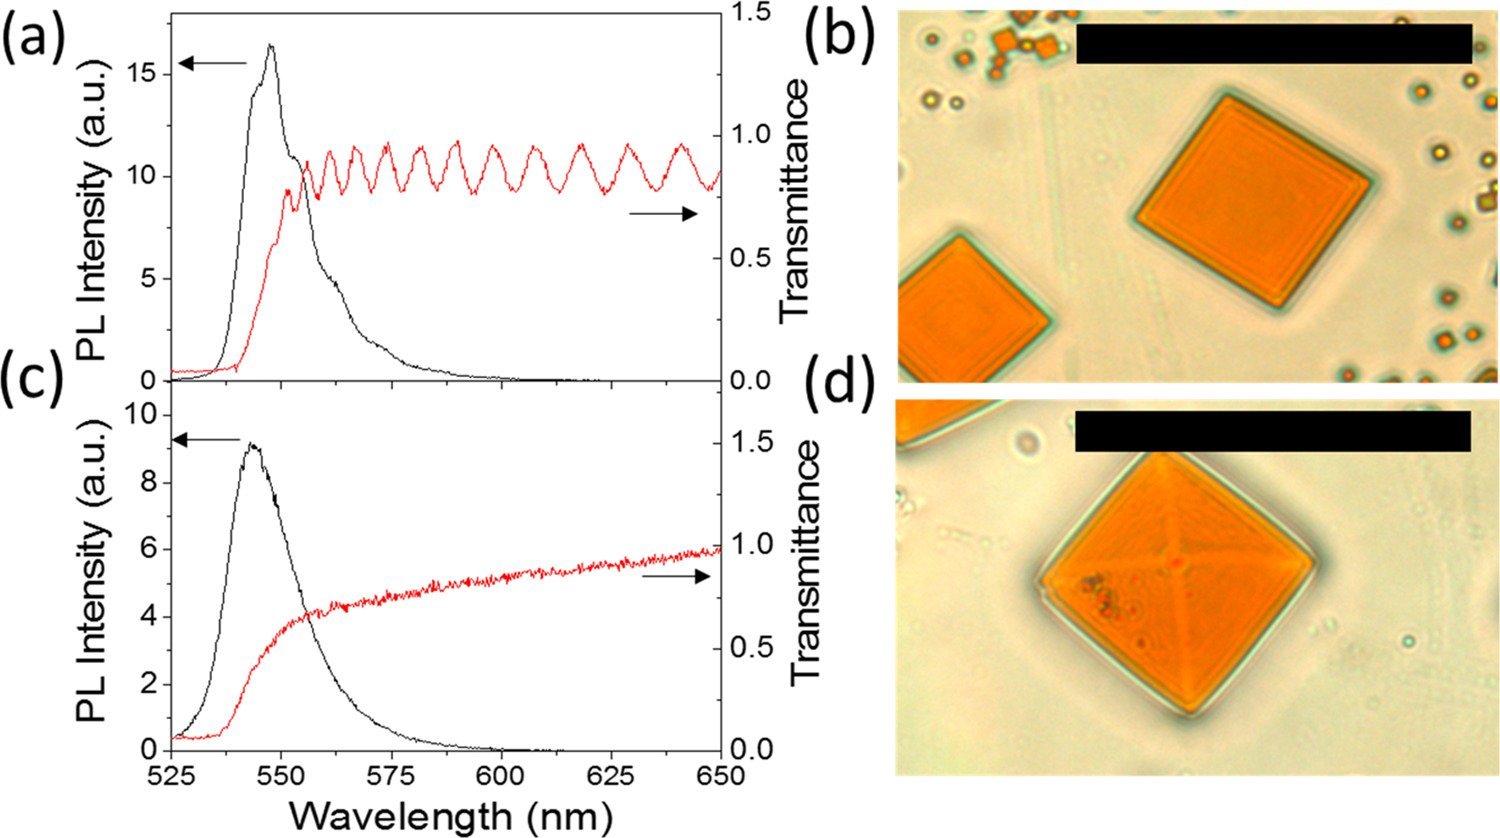
Synthesis and studies of single crystals of hybrid perovskite are important for achieving a better understanding of the optoelectronic phenomena occurring in this material and for improving ongoing applications. Here, we report on the growth of micrometer-size single crystals of methylammonium lead bromide (MAPbBr3) using the spin coating deposition method on a quartz substrate. We studied the influence of the rotation speed and the use of three different additives N-cyclohexyl-2-pyrrolidone, dimethyl sulfoxide, and 4-tert-butylpyridine on the crystal size and shape. The introduction of an additive in the precursor solution is revealed to be very useful for obtaining crystals with well-defined geometries and for decreasing the amount of defects. In this way, high-quality single crystals that sustain optical resonating modes were obtained and characterized by transmittance and photoluminescence measurements.
Figures
From R. García-Aboal et al., ACS Omega 3, 5229-5236 (2018), DOI 10.1021/acsomega.8b00447. © 2018 American Chemical Society. Reproduced for non-commercial research communication under the ACS AuthorChoice usage agreement.
From R. García-Aboal et al., ACS Omega 3, 5229-5236 (2018), DOI 10.1021/acsomega.8b00447. © 2018 American Chemical Society. Reproduced for non-commercial research communication under the ACS AuthorChoice usage agreement.
From R. García-Aboal et al., ACS Omega 3, 5229-5236 (2018), DOI 10.1021/acsomega.8b00447. © 2018 American Chemical Society. Reproduced for non-commercial research communication under the ACS AuthorChoice usage agreement.
From R. García-Aboal et al., ACS Omega 3, 5229-5236 (2018), DOI 10.1021/acsomega.8b00447. © 2018 American Chemical Society. Reproduced for non-commercial research communication under the ACS AuthorChoice usage agreement.
From R. García-Aboal et al., ACS Omega 3, 5229-5236 (2018), DOI 10.1021/acsomega.8b00447. © 2018 American Chemical Society. Reproduced for non-commercial research communication under the ACS AuthorChoice usage agreement.

From R. García-Aboal et al., ACS Omega 3, 5229-5236 (2018), DOI 10.1021/acsomega.8b00447. © 2018 American Chemical Society. Reproduced for non-commercial research communication under the ACS AuthorChoice usage agreement.
From R. García-Aboal et al., ACS Omega 3, 5229-5236 (2018), DOI 10.1021/acsomega.8b00447. © 2018 American Chemical Society. Reproduced for non-commercial research communication under the ACS AuthorChoice usage agreement.
From R. García-Aboal et al., ACS Omega 3, 5229-5236 (2018), DOI 10.1021/acsomega.8b00447. © 2018 American Chemical Society. Reproduced for non-commercial research communication under the ACS AuthorChoice usage agreement.
From R. García-Aboal et al., ACS Omega 3, 5229-5236 (2018), DOI 10.1021/acsomega.8b00447. © 2018 American Chemical Society. Reproduced for non-commercial research communication under the ACS AuthorChoice usage agreement.
How to cite
Article access and reuse
This is an open-access article published under the Standard ACS AuthorChoice usage agreement, which permits non-commercial copying, display and redistribution with attribution and a prominent link to the definitive ACS version. The complete embedded figure compositions below were extracted directly from the article PDF without changing their content.
Related publications
Research fields
Bottom-up
MAPbBr₃ single microcrystals are grown directly on quartz by spin coating. Rotation speed and three solvent additives are varied systematically, showing how evaporation and precursor coordination control crystal size, coverage and morphology in a simple deposition process.
Characterization
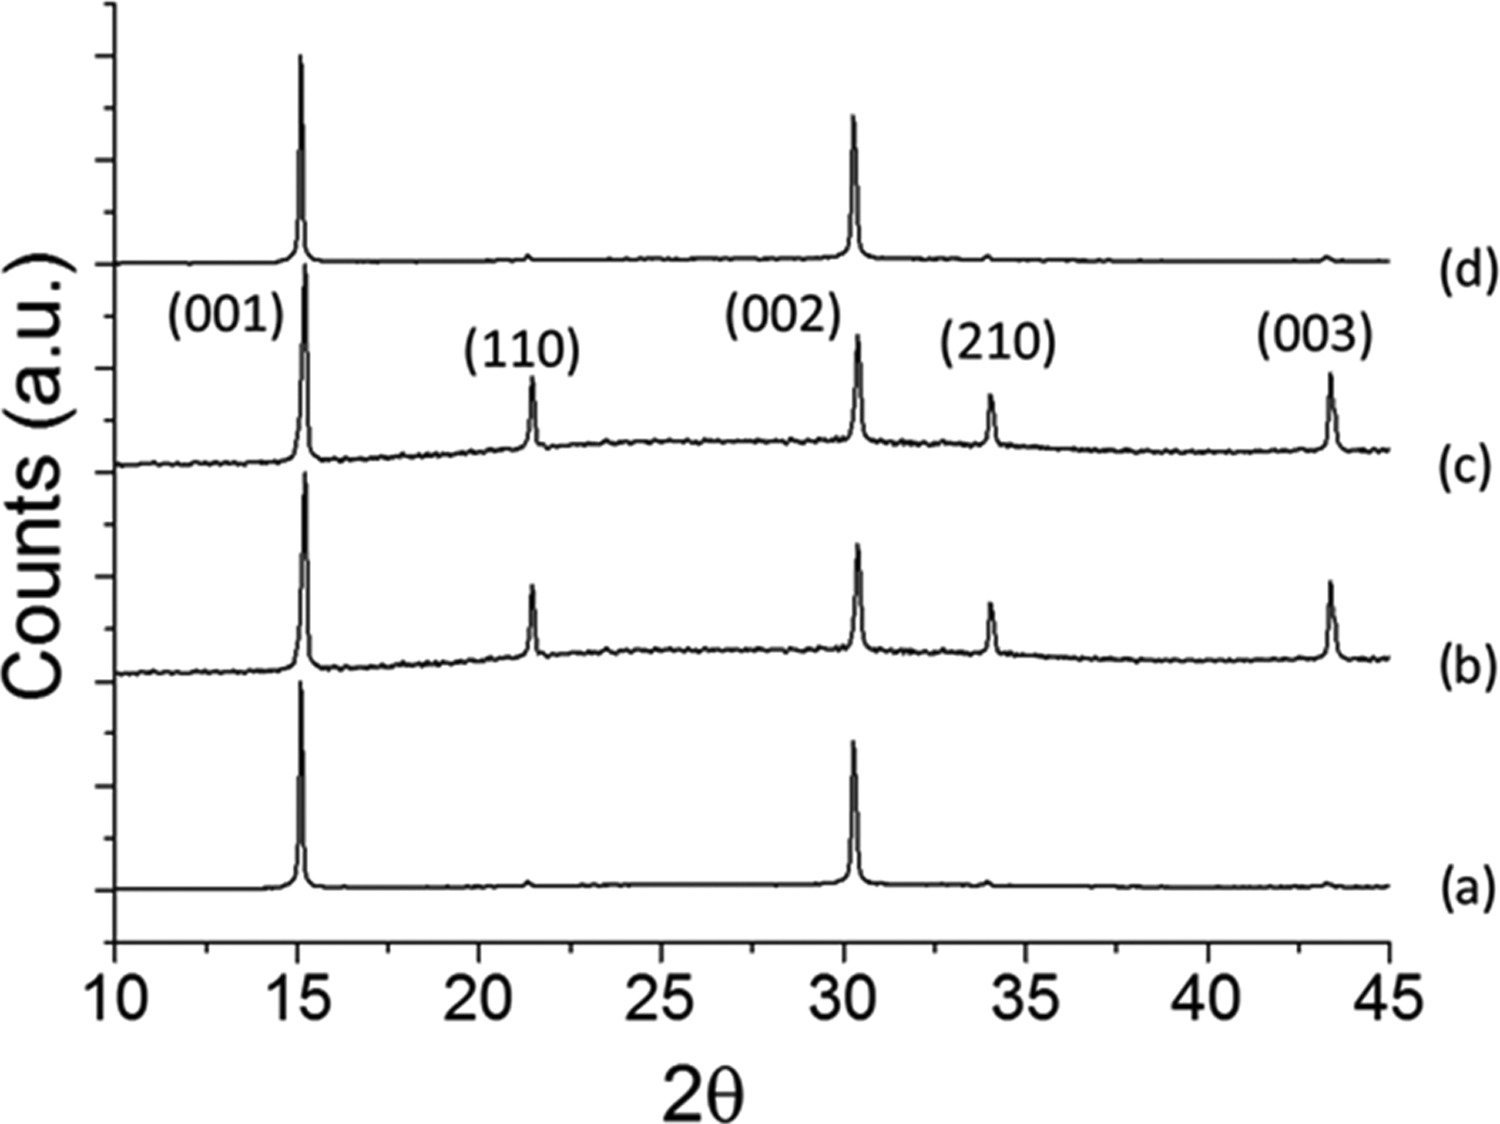
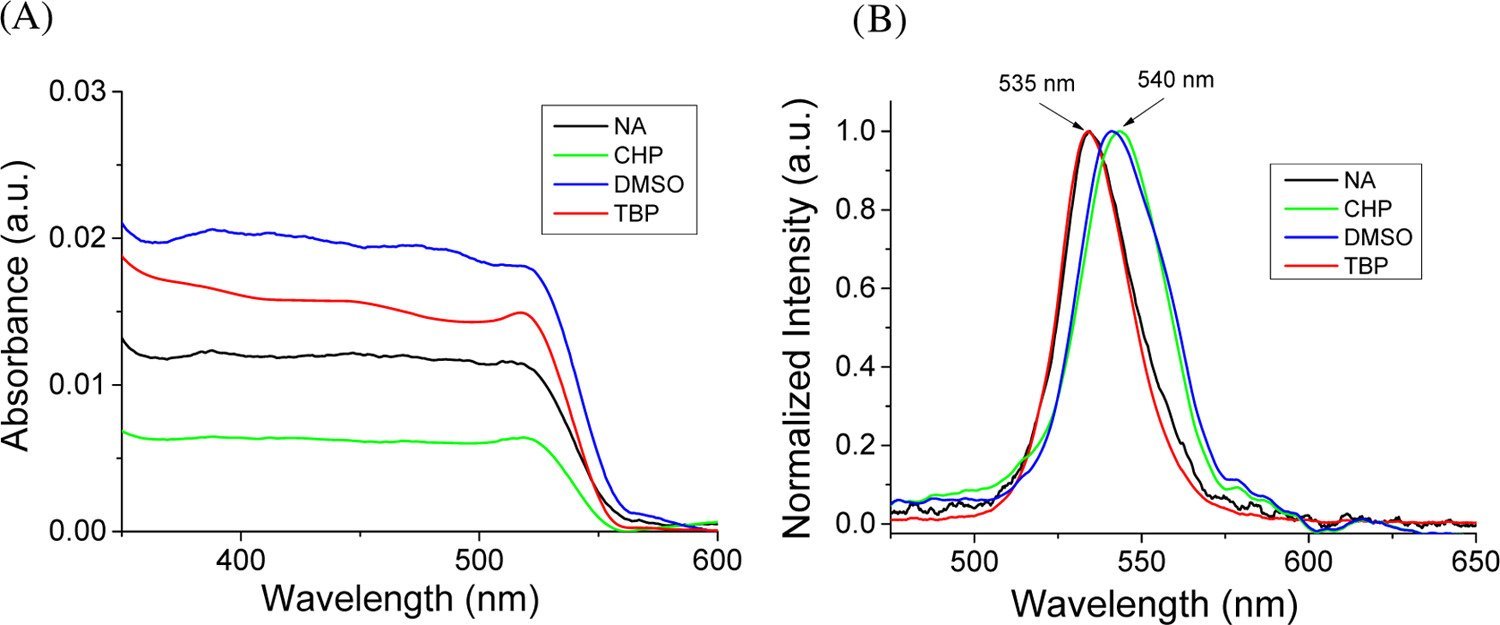
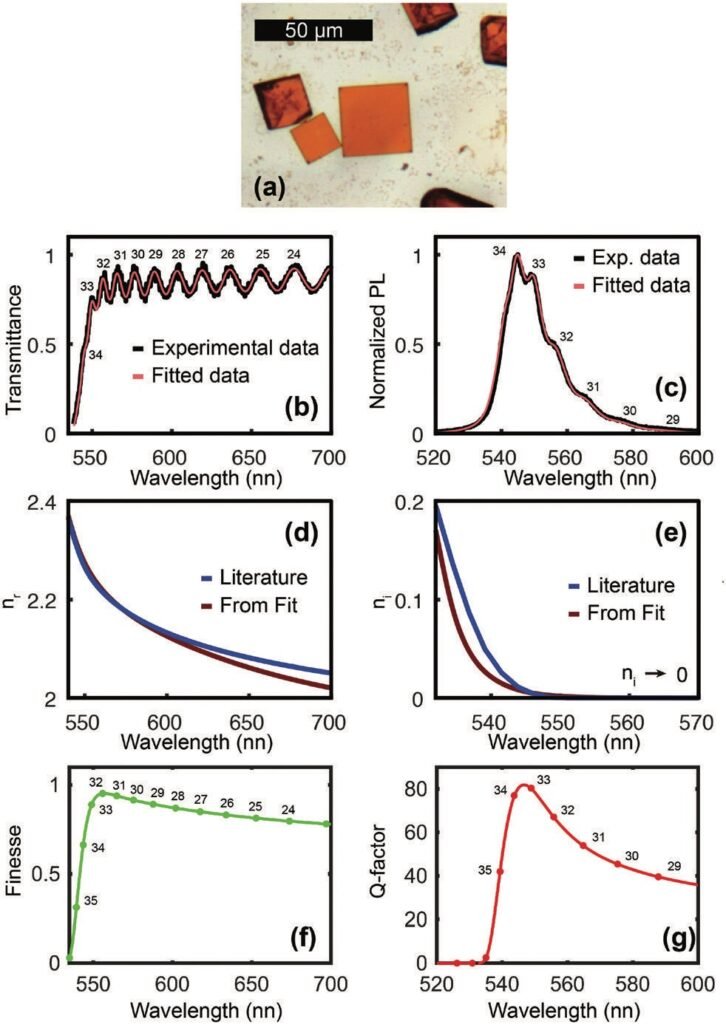
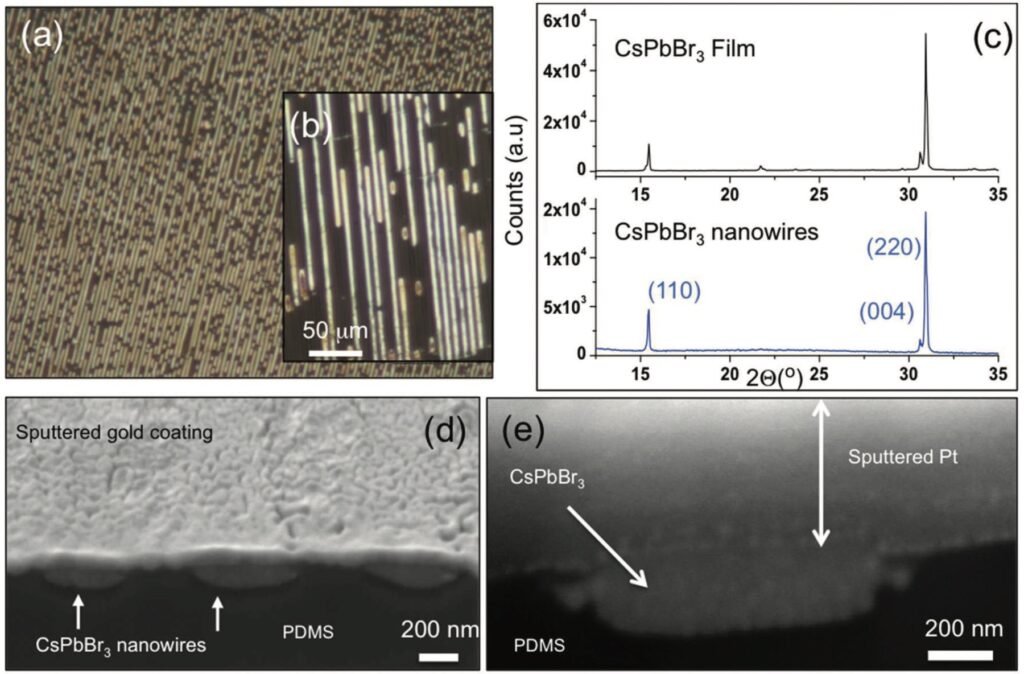
Statistical optical microscopy is combined with SEM, X-ray diffraction, absorption and photoluminescence. The measurements connect each processing condition with crystal dimensions, phase purity and emission, rather than judging growth from surface appearance alone.
RESEARCH TOPICS
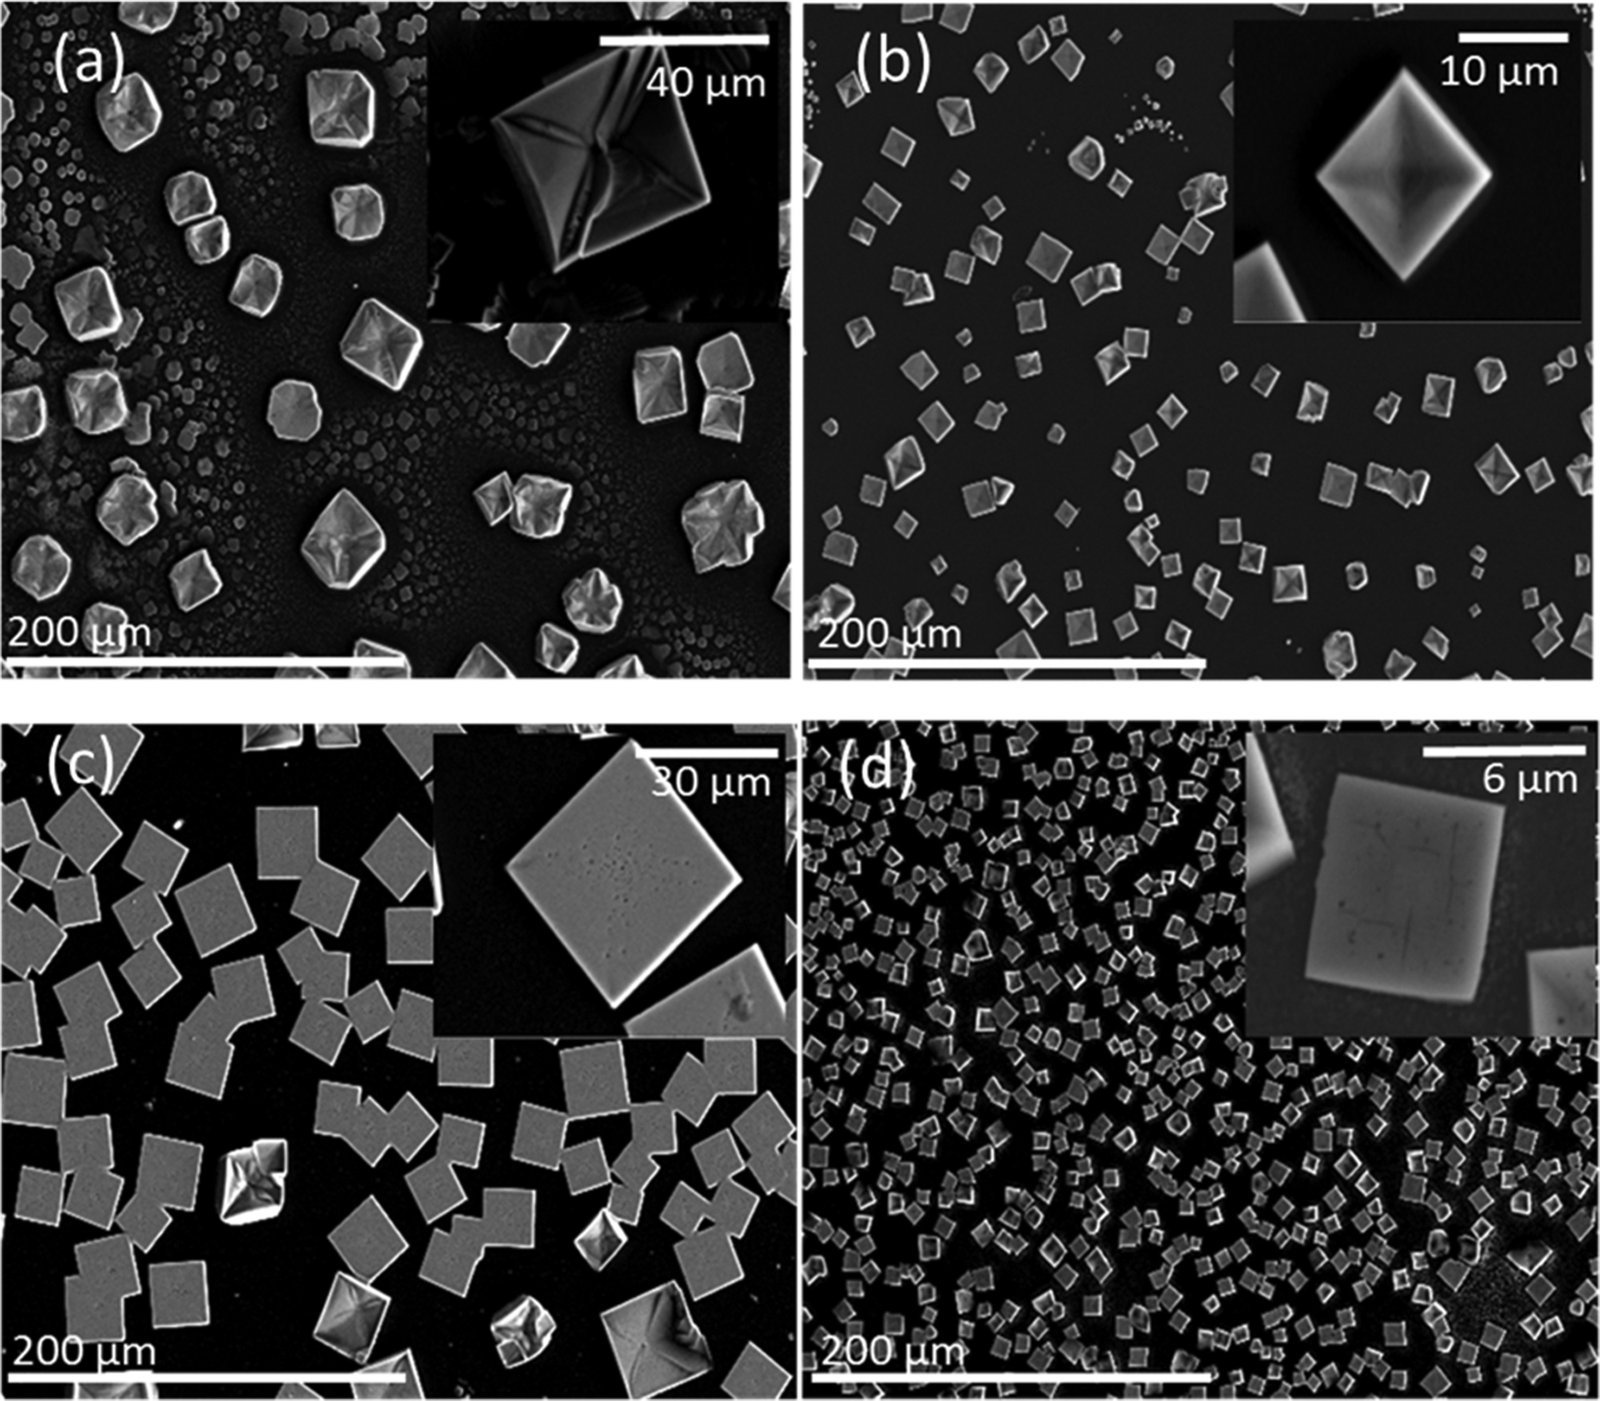
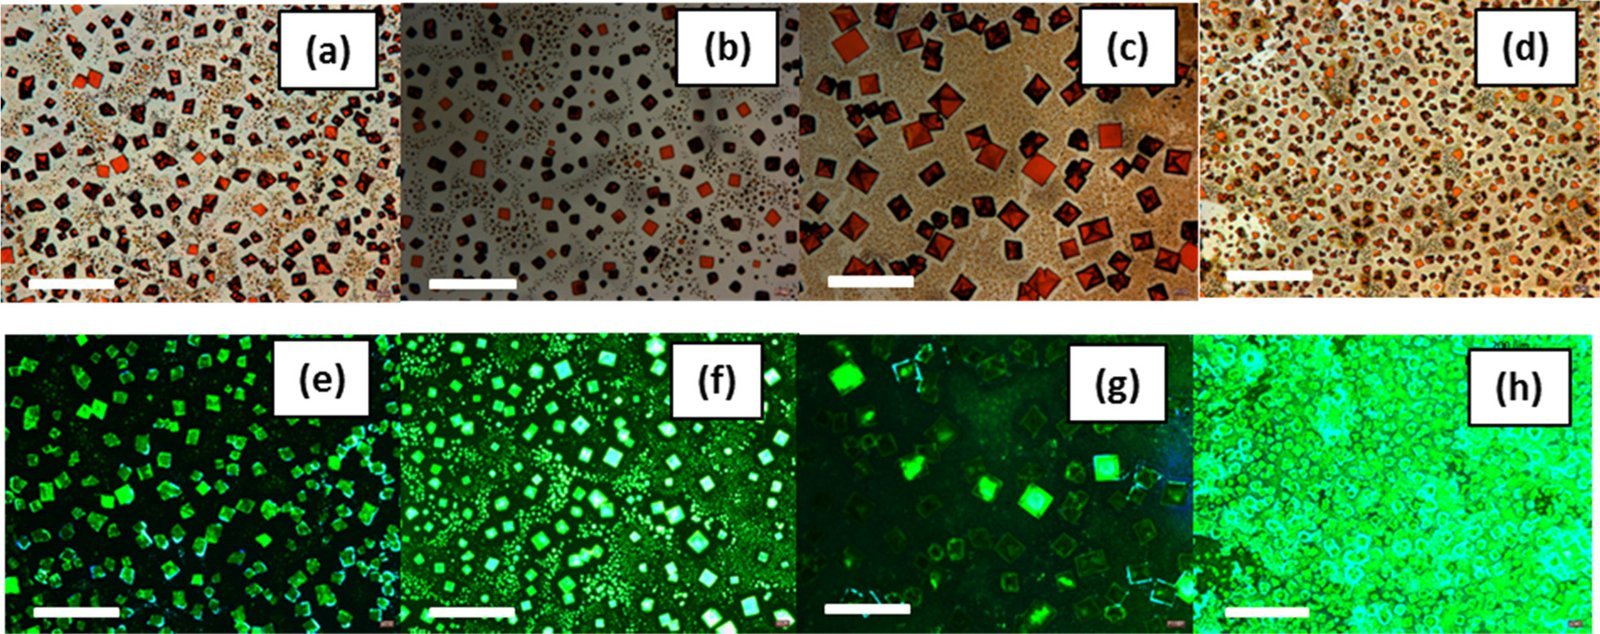
 MaterialsSEM and optical microscopy in Figures 2 and 4 show how additive and rotation speed change the population from small grains to rods, cuboids and plates. This morphology control is important because fewer grain boundaries can reduce charge trapping and recombination.
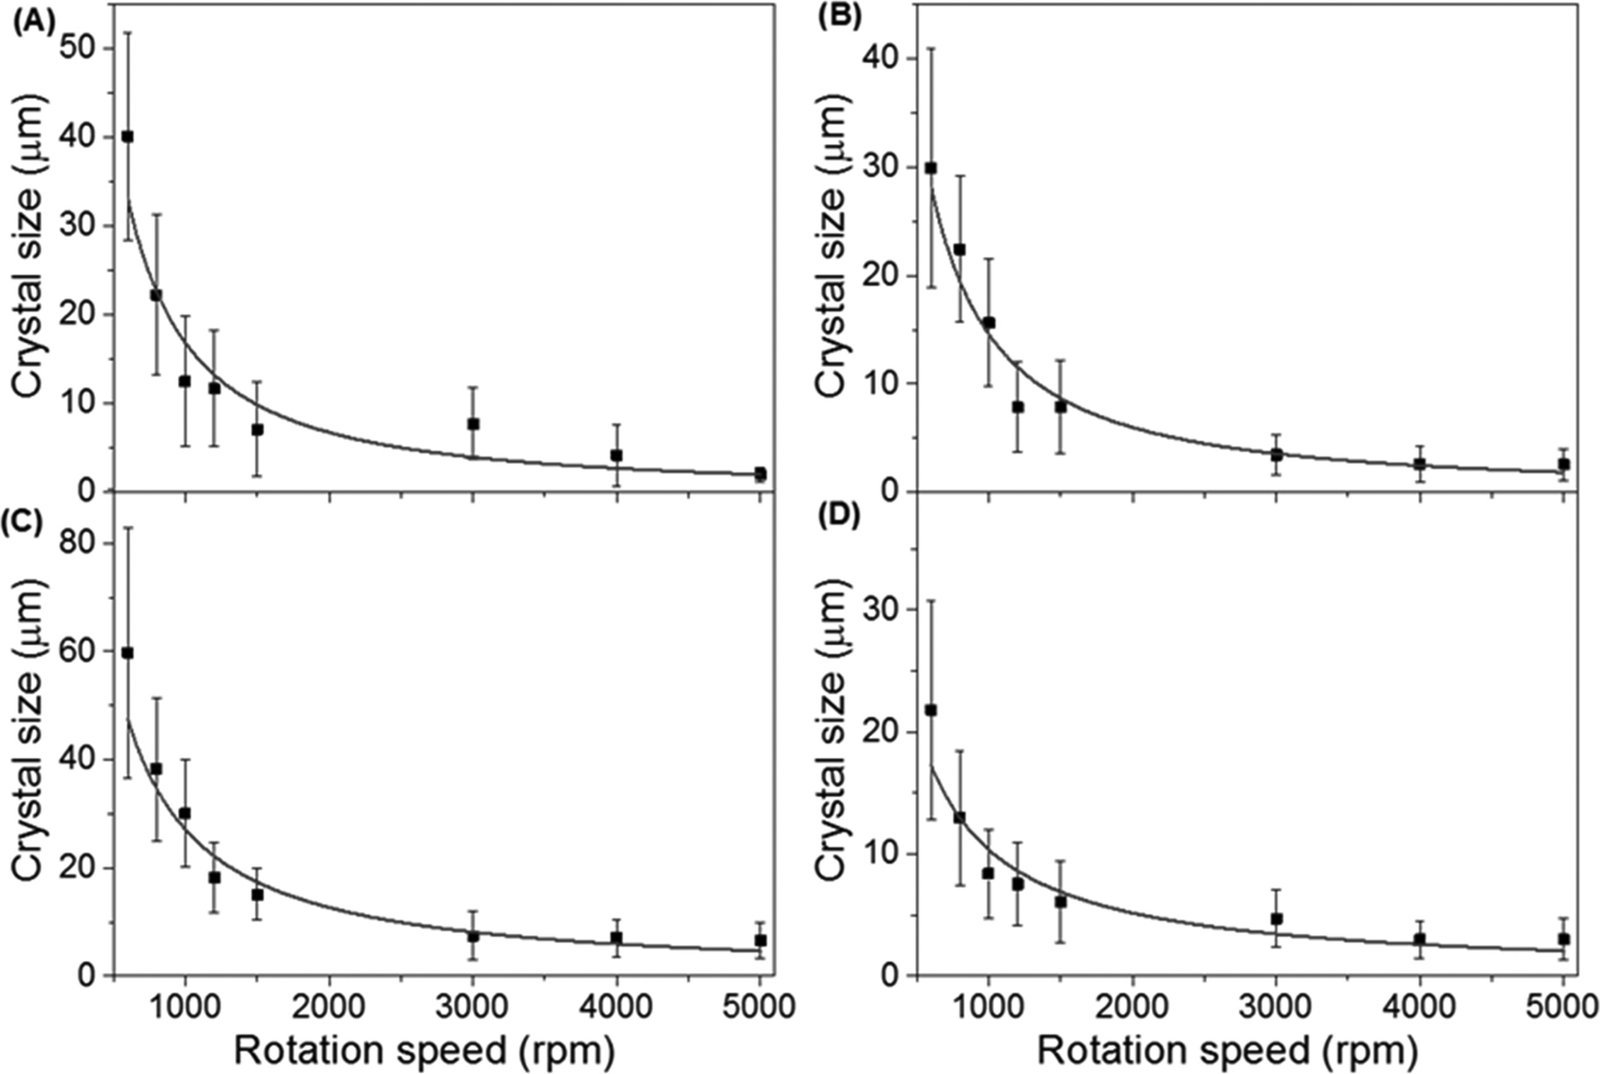
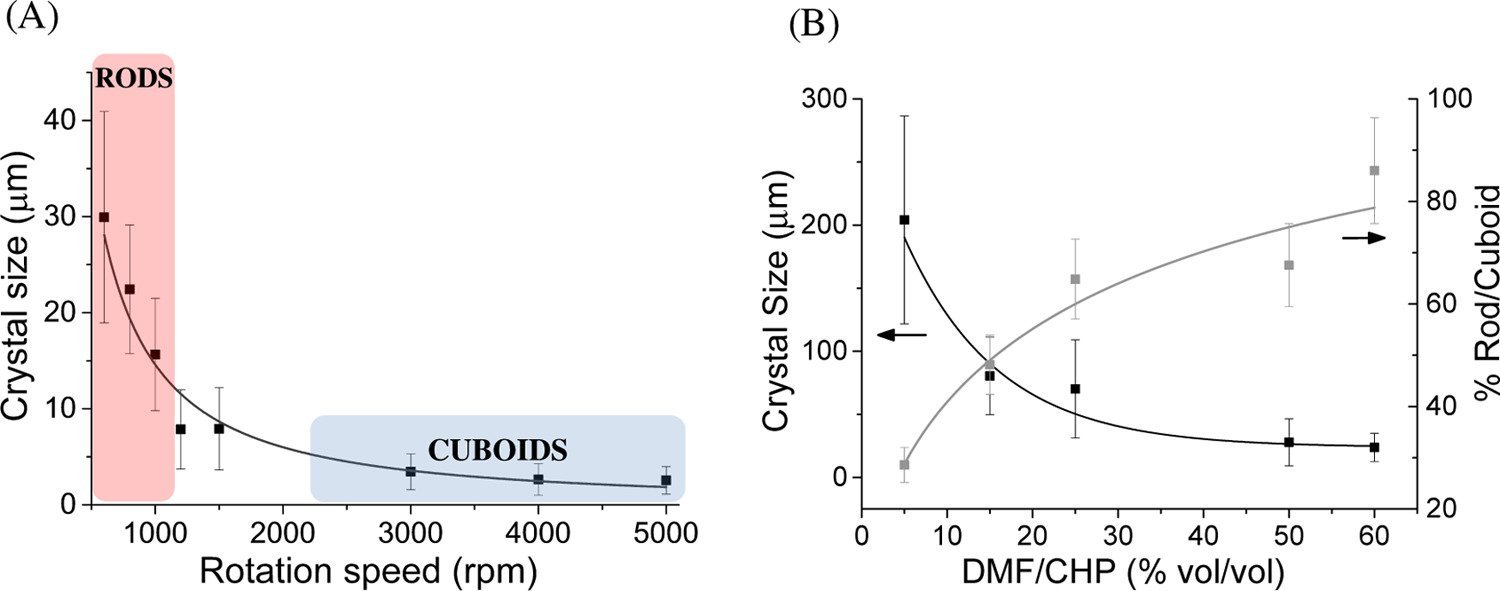
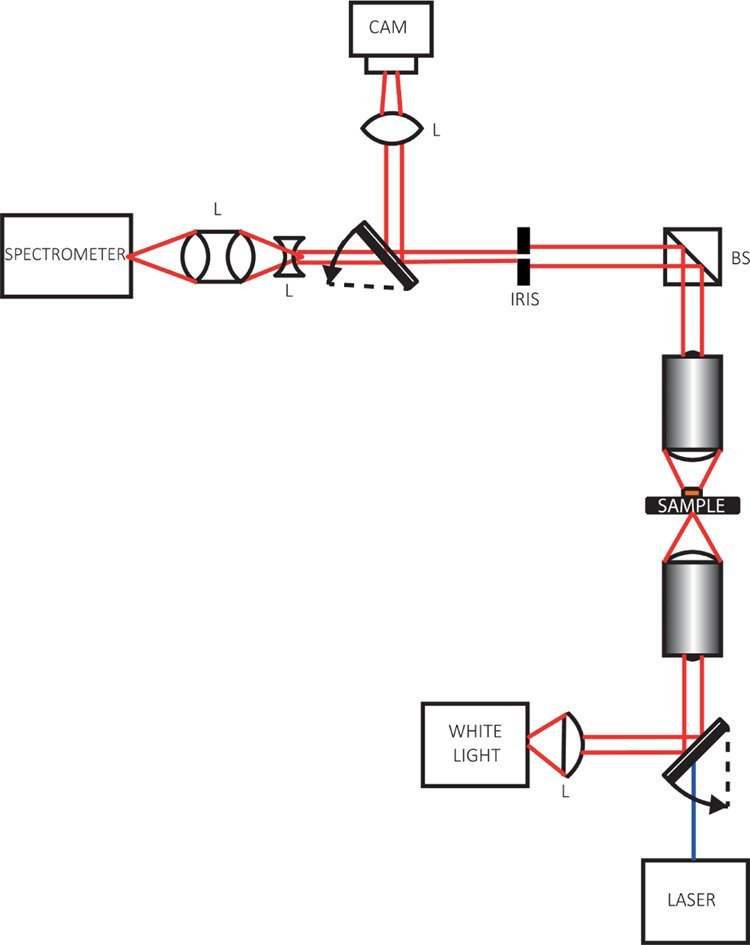
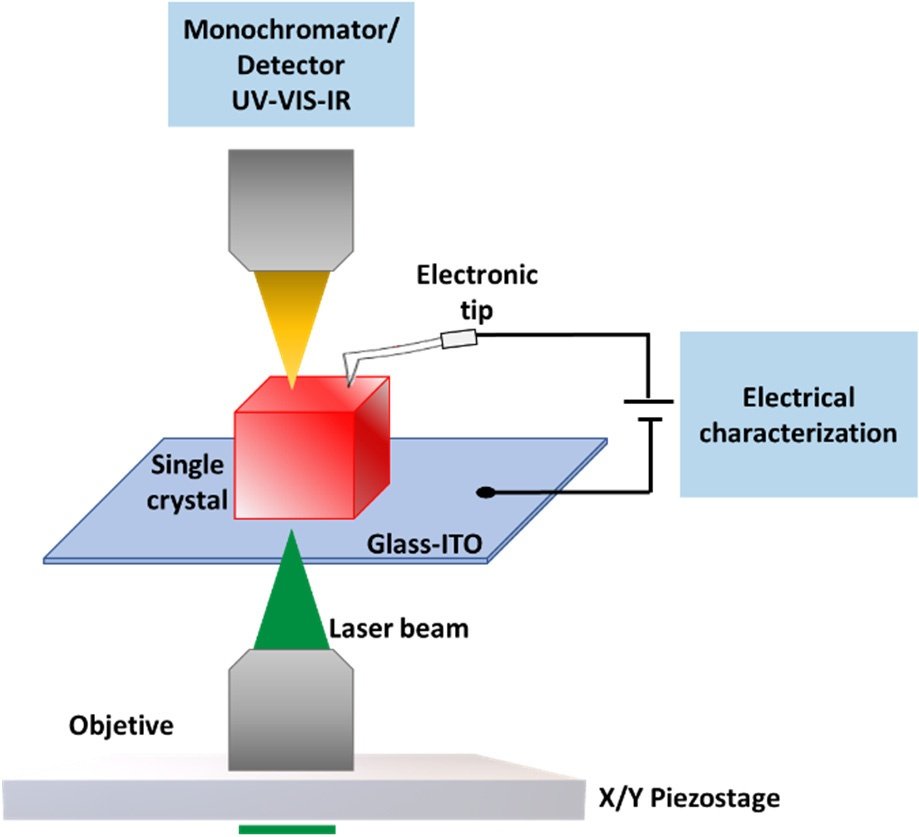
 SetupsFigures 6 and 7 turn the microscopy observations into quantitative trends by tracking average crystal size and the rod-to-cuboid ratio against additive concentration. Optical characterization then selects individual crystals with a microscope, switches the collected signal between a CCD camera and an iHR320 spectrometer with a liquid-nitrogen-cooled silicon detector, and records photoluminescence and transmission from the same object rather than from an ensemble.
 ChemistryThree coordinating additives (N-cyclohexyl-2-pyrrolidone (CHP), DMSO and tert-butylpyridine) are compared because they alter nucleation and crystal growth during solvent evaporation. CHP provides particularly broad morphological control as its concentration is increased.