F. Ramiro-Manzano, website logo

Publication - Journal Article

Advanced Optical Materials 2300135 (2023)
DOI: doi.org/10.1002/adom.202300135
Link  to the journal
Link to the manuscript
Link to the supporting information

Silicon Microspheres for Super-Planckian Light Sources in the Mid Infrared

R. Fenollosa, F. Ramiro-Manzano, M. Garín, and F. Meseguer

Abstract

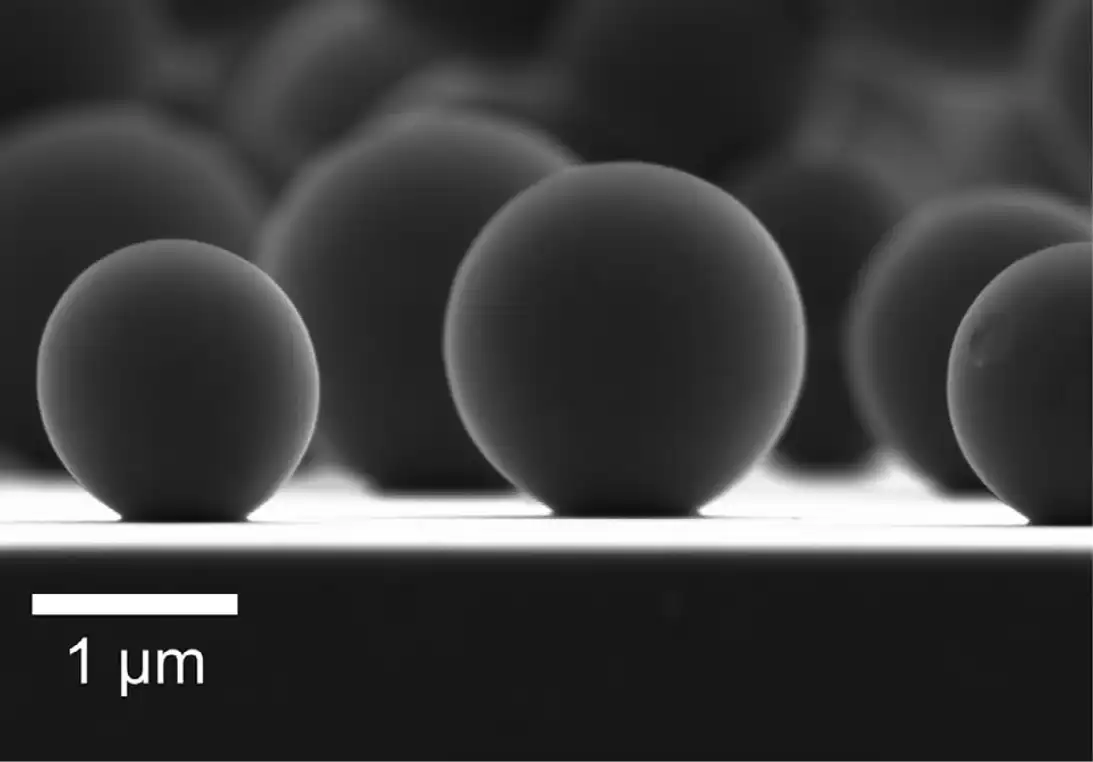
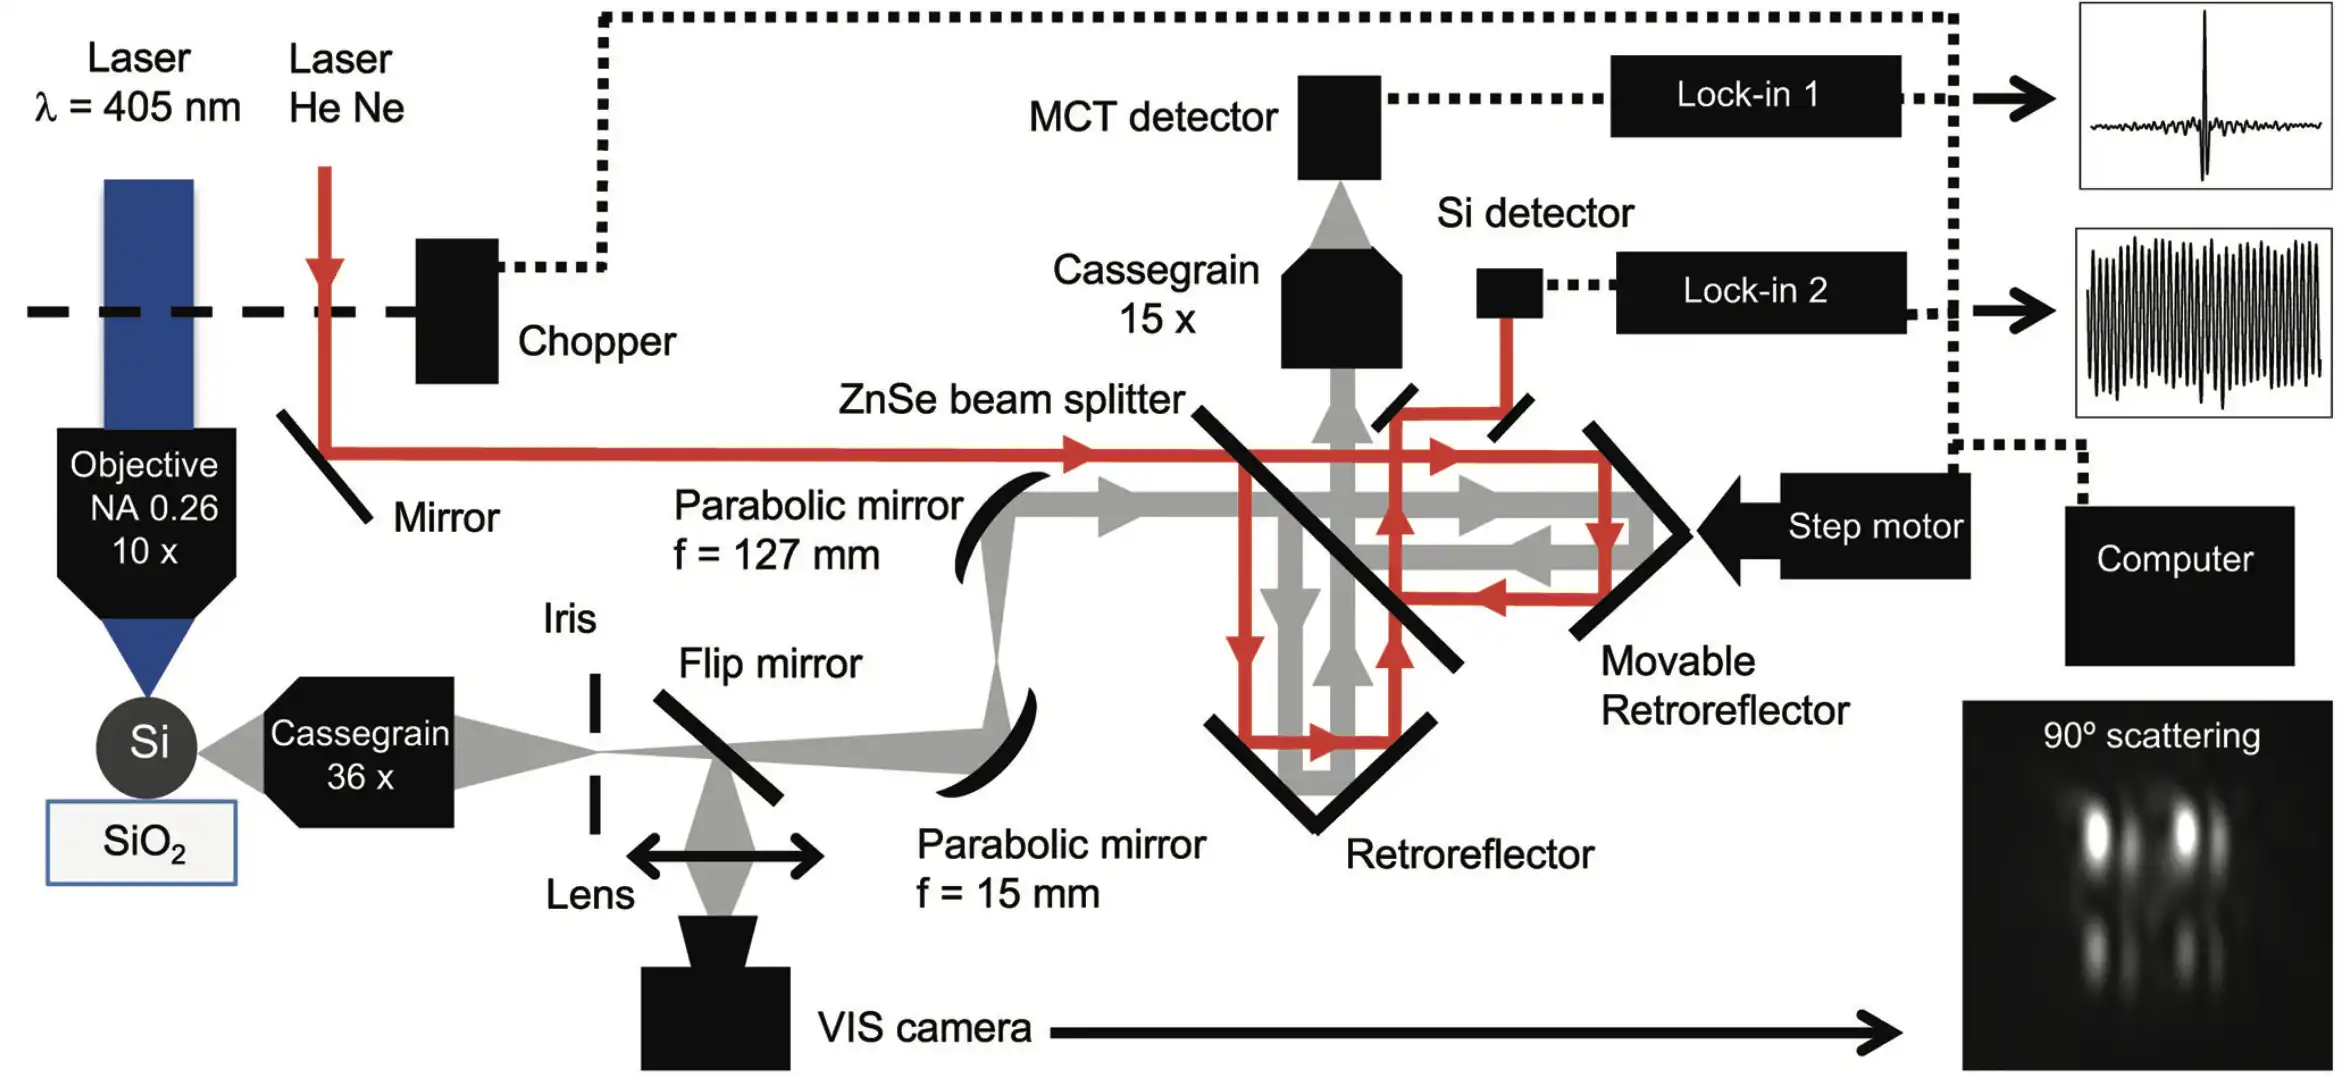
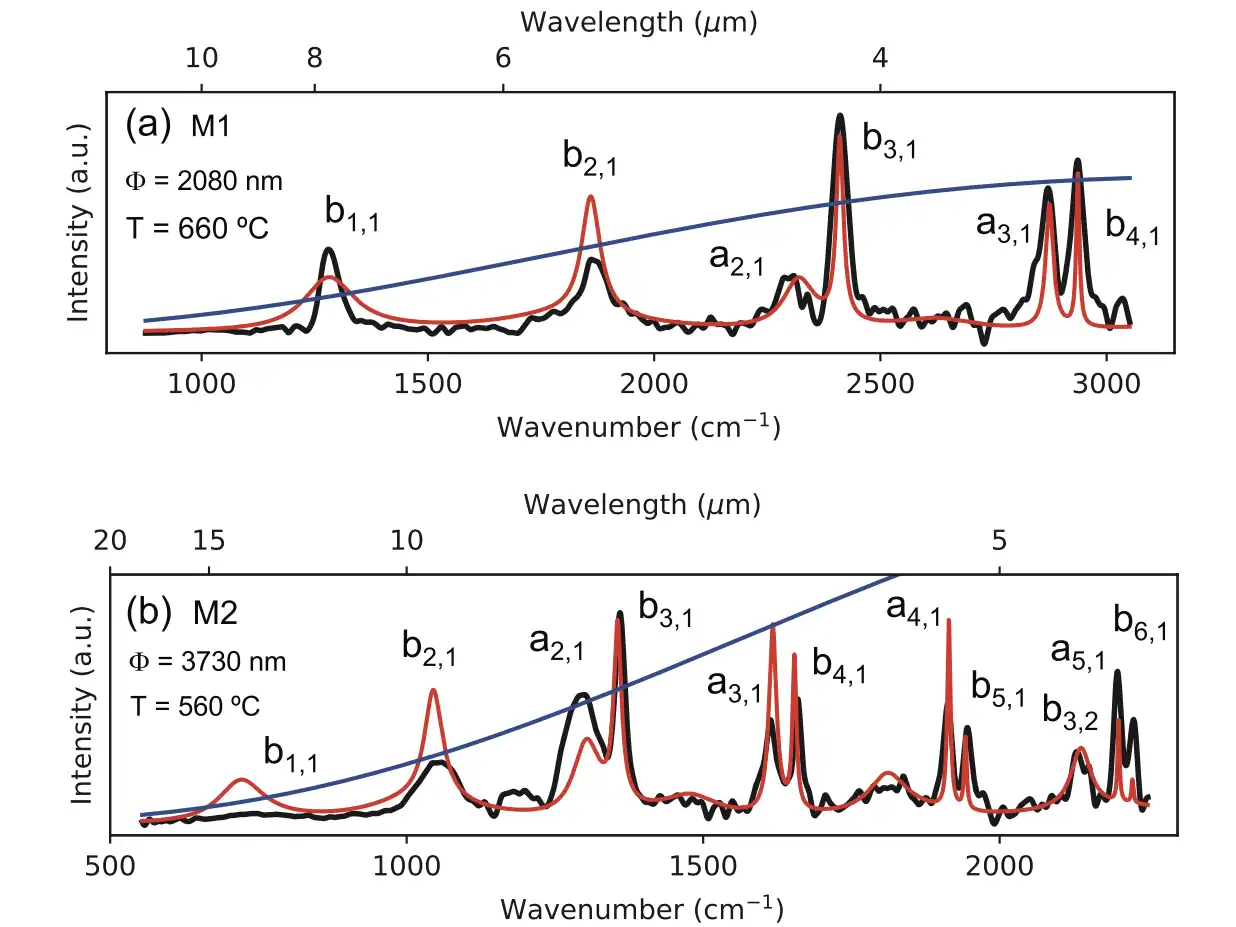
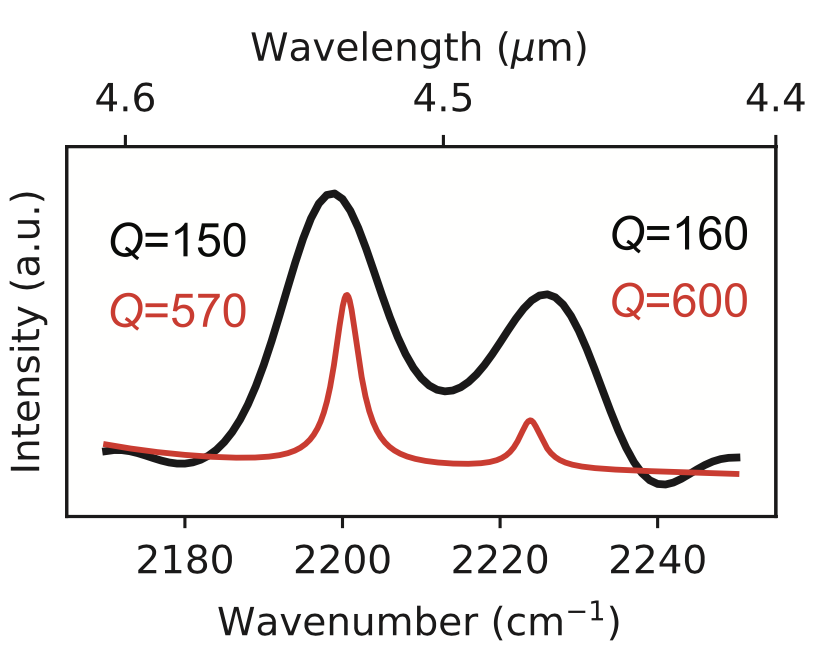
Silicon microspheres with a diameter in the range of 2–3 micrometers constitute photonic nanocavities that emit light through their Mie resonances when heated at high temperatures. At 500–600 °C these microresonators show a particular mid-infrared (MIR) emission dominated by the lowest order modes. Such resonances feature a large free spectral range, about 600 cm−1, and a high proximity to the critical coupling condition. In fact, resonances with high-quality factor, around 160 are found. It corresponds to the limit of detection of their measuring setup, being 600 the theoretical value. Most importantly, several modes emit light above the calculated black body limit because they feature an optical absorption cross-section larger than their geometric one. All these characteristics set silicon microspheres as very promising zero-dimensional materials for developing micrometric and sub-wavelength light sources in the MIR.


Figures

Fig 1. SEM Image of as as-synthesized poly- crystalline silicon microspheres.
Esperimental setup of home-made Fourier transform interferometer for MidIR Emission measurements
Fig. 2 Esperimental setup of home-made Fourier transform interferometer for MidIR Emission measurements
Super-Plankian Light source in the MidIR
Fig 3. a) Measured thermal emission spectrum (black line) of a silicon microsphere with 2080 nm in diameter. The red curve corresponds to the fit of the experimental data to Equation (1) with a fitted temperature of 660 °C (M1 in Table 1). The blue line is the calculated emission of a black body that has an area equal to the geometric projected area of the microsphere. The modes associated to each peak are indicated. b) Same as (a) but for a 3730 nm in diameter microsphere with a fitted temperature of 560 °C (M2 in Table 1).
Calculatedqualityfactorassociatedwithabsorption,Qabs,(blue and red lines), and with intrinsic radiative curvature losses, Qrad (blue and red dots) for several modes of M1 and M2 respectively. They are close to the critical coupling condition (Qrad = Qabs)
Fig. 4. Calculatedqualityfactorassociatedwithabsorption,Qabs,(blue and red lines), and with intrinsic radiative curvature losses, Qrad (blue and red dots) for several modes of M1 and M2 respectively. They are close to the critical coupling condition (Qrad = Qabs)
The zoomed spectral zone corresponding to modes a5,1 and b6,1 of M2. The Q-values obtained by fitting the experimental (black line) and theoretical (red line) spectra to a curve consisting of the summation of two lorentizans are indicated beside each peak.
Fig. 5 The zoomed spectral zone corresponding to modes a5,1 and b6,1 of M2. The Q-values obtained by fitting the experimental (black line) and theoretical (red line) spectra to a curve consisting of the summation of two lorentizans are indicated beside each peak.
Calculated scattering efficiency, qsca, of a silicon microsphere with a diameter of 2080 nm (equal to that of M1) at zero absorption. The dashed red line indicates the limit above which a resonance can yield emis- sion above the Planck limit as long as it is at Q-matching condition. These resonances have been indicated beside their corresponding peak.
Fig. 6 Calculated scattering efficiency, qsca, of a silicon microsphere with a diameter of 2080 nm (equal to that of M1) at zero absorption. The dashed red line indicates the limit above which a resonance can yield emis- sion above the Planck limit as long as it is at Q-matching condition. These resonances have been indicated beside their corresponding peak.
Calculated sphere diameter (black line) that maximizes the ab- sorptionefficiency,qabs,(redline)atthetemperatureoftheM1experiment (660 °C). It is achieved in several spectral sections through different indi- cated resonances. The dashed line specifies the sphere diameter of M1 (2080 nm). The intersections with the continuous black line, indicated by the blue arrows, correspond with resonances b2,1 and b3,1 of Figure 3a and they indicate that maximized emission has been achieved at those spectral positions.
Fig 7. Calculated sphere diameter (black line) that maximizes the ab- sorptionefficiency,qabs,(redline)atthetemperatureoftheM1experiment (660 °C). It is achieved in several spectral sections through different indi- cated resonances. The dashed line specifies the sphere diameter of M1 (2080 nm). The intersections with the continuous black line, indicated by the blue arrows, correspond with resonances b2,1 and b3,1 of Figure 3a and they indicate that maximized emission has been achieved at those spectral positions.

Link to the supporting information

License/Copyright

Open Access article, reproduced from Ref. Advanced Optical Materials 2300135 (2023)  with permission from Wiley
Fernando Ramiro Manzano, PhD 
Email:
ferraman(at)fis.upv.es
Substitute (at) with @
Phone:
(+34) 96 387 9841
Address:
CTF-ITQ, UPV, Edificio 8B, Avda. Los Naranjos SN, 46360 - Valencia, Spain
This website has been created using Wordpress and the Oxygen builder. To achieve parallax effects, the Vanilla Javascript Parallax Library 'Rellax' (Dixon & Moe) was utilized. Most of the graphical content, such as icons and images, has been created specifically for this website, with the exception of the link favicons and journal copyright material, which have been used with permission from their respective publishers. If there are any questions ir problems regarding permissions, please do not hesitate to contact me.

Thank you for visiting my Website.
Fernando.
LOGO Nanomaterials for optoelectronics, photonics and energy, ITQ, CSIC, UPV, Severo Ochoa