This website has been created using Wordpress and the Oxygen builder. To achieve parallax effects, the Vanilla Javascript Parallax Library 'Rellax' (Dixon & Moe) was utilized. Most of the graphical content, such as icons and images, has been created specifically for this website, with the exception of the link favicons and journal copyright material, which have been used with permission from their respective publishers. If there are any questions ir problems regarding permissions, please do not hesitate to contact me.
Thank you for visiting my Website.
Fernando.
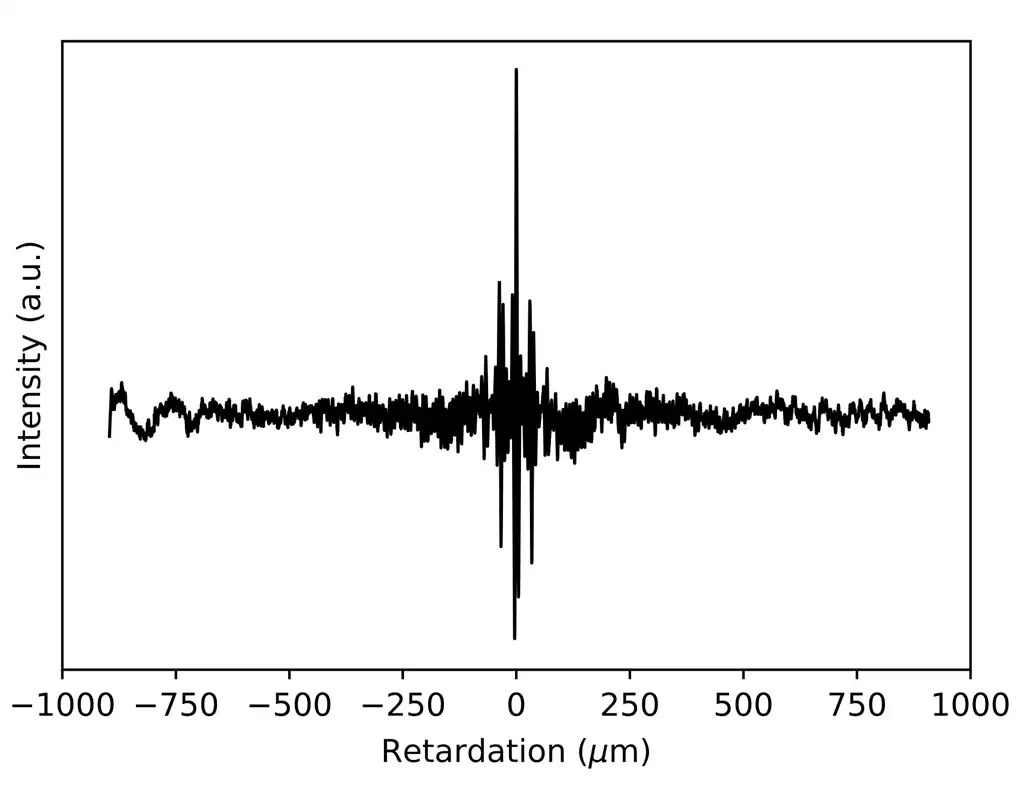
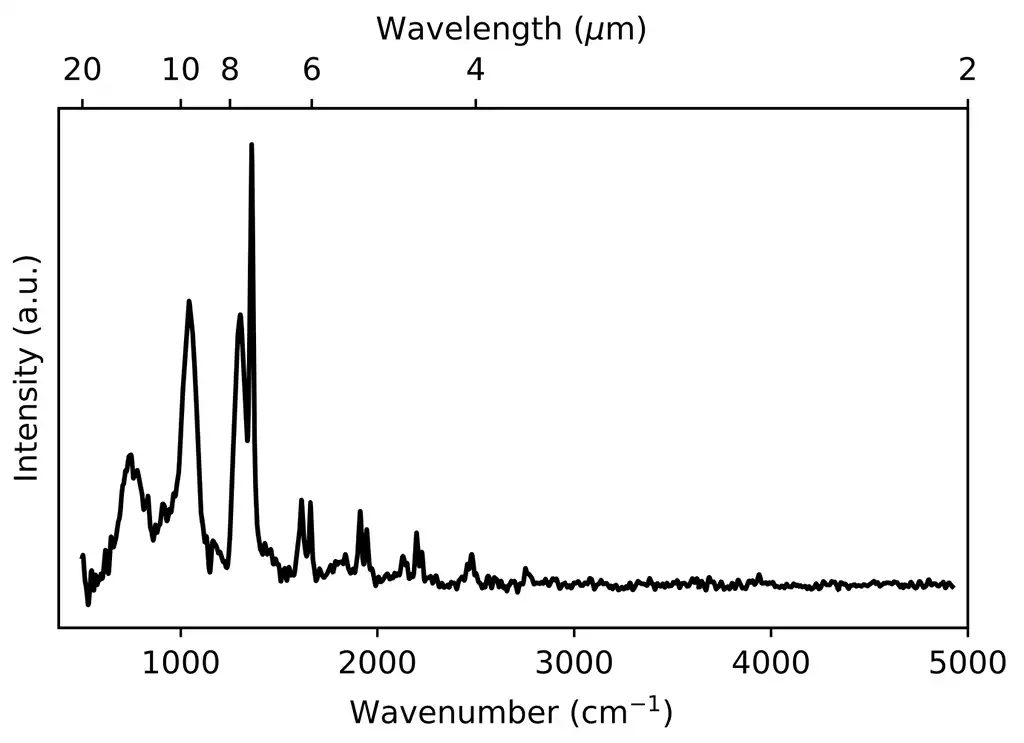
![Thermal emission spectrum of microsphere resonator (f = 2080 nm, T = 660o C) as obtained from the Fourier transform of the interferogram of Figure S1 after performing Gaussian apodization.[1] The spectrum is not corrected by the sensitivity of the system.](https://f.ramiro-manzano.es/wp-content/uploads/2023/04/article-2023-fenollosa-adv-opt-mater-fig-s2.webp)