
Research · Publication & note
Optical Properties of Organic/Inorganic Perovskite Microcrystals through the Characterization of Fabry–Pérot Resonances
Journal article
Abstract
A precise knowledge of the optical properties, specifically the refractive index, of organic/inorganic perovskites, is essential for pushing forward the performance of the current photovoltaic devices that are being developed from these materials. Here we show a robust method for determining the real and the imaginary part of the refractive index of MAPbBr₃ thin films and micrometer size single crystals with planar geometry. The simultaneous fit of both the optical transmittance and the photoluminescence spectra to theoretical models defines unambiguously the refractive index and the crystal thickness. Because the method relies on the optical resonance phenomenon occurring in these microstructures, it can be used to further develop optical microcavities from perovskites or from other optical materials.
How to cite
Article access and reuse
The Version of Record is available from the Royal Society of Chemistry and is not hosted on this website. RSC authors retain the right to reuse their own figures on personal websites when the original article is properly acknowledged. The four figures below are complete, unmodified compositions extracted from the article PDF.
Figures
© 2020 The Royal Society of Chemistry. Source: F. Ramiro-Manzano et al., Dalton Transactions 49(36), 12798–12804 (2020), DOI 10.1039/D0DT02254C. Reproduced by the authors in accordance with RSC author reuse rights.
© 2020 The Royal Society of Chemistry. Source: F. Ramiro-Manzano et al., Dalton Transactions 49(36), 12798–12804 (2020), DOI 10.1039/D0DT02254C. Reproduced by the authors in accordance with RSC author reuse rights.
© 2020 The Royal Society of Chemistry. Source: F. Ramiro-Manzano et al., Dalton Transactions 49(36), 12798–12804 (2020), DOI 10.1039/D0DT02254C. Reproduced by the authors in accordance with RSC author reuse rights.
© 2020 The Royal Society of Chemistry. Source: F. Ramiro-Manzano et al., Dalton Transactions 49(36), 12798–12804 (2020), DOI 10.1039/D0DT02254C. Reproduced by the authors in accordance with RSC author reuse rights.
Research fields
Bottom-up
Solution-grown MAPbBr₃ microcrystals act simultaneously as the material under study and as naturally formed planar cavities. Their parallel crystal faces generate Fabry–Pérot resonances without adding a separately fabricated resonator.
Simulations & fits
Transmittance and photoluminescence are fitted together with analytical cavity models that include absorption, dispersion, sample thickness and the numerical aperture of the collection optics. This joint treatment extracts both parts of the refractive index around the electronic band edge.
Characterization
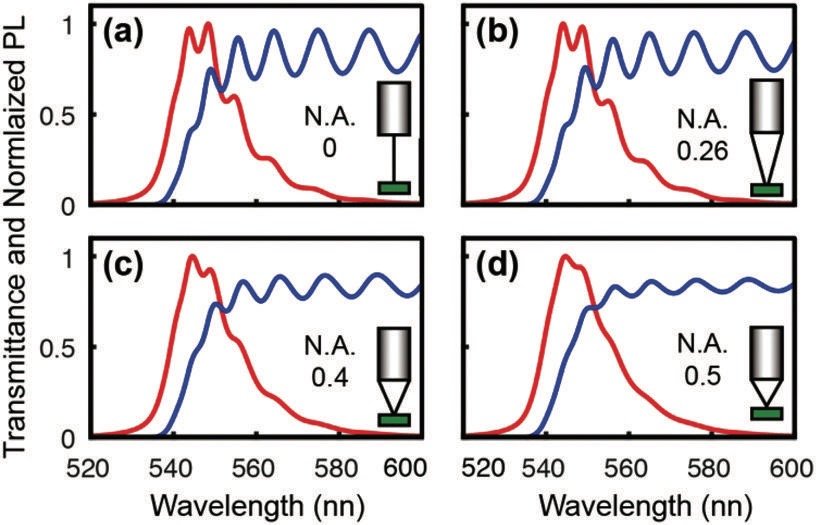
Angle-collecting microscope objectives record complementary transmission and emission spectra from the same microcrystal. Tracking how their resonance envelopes respond differently to numerical aperture provides an internal check on the fitted thickness and optical constants.
RESEARCH TOPICS
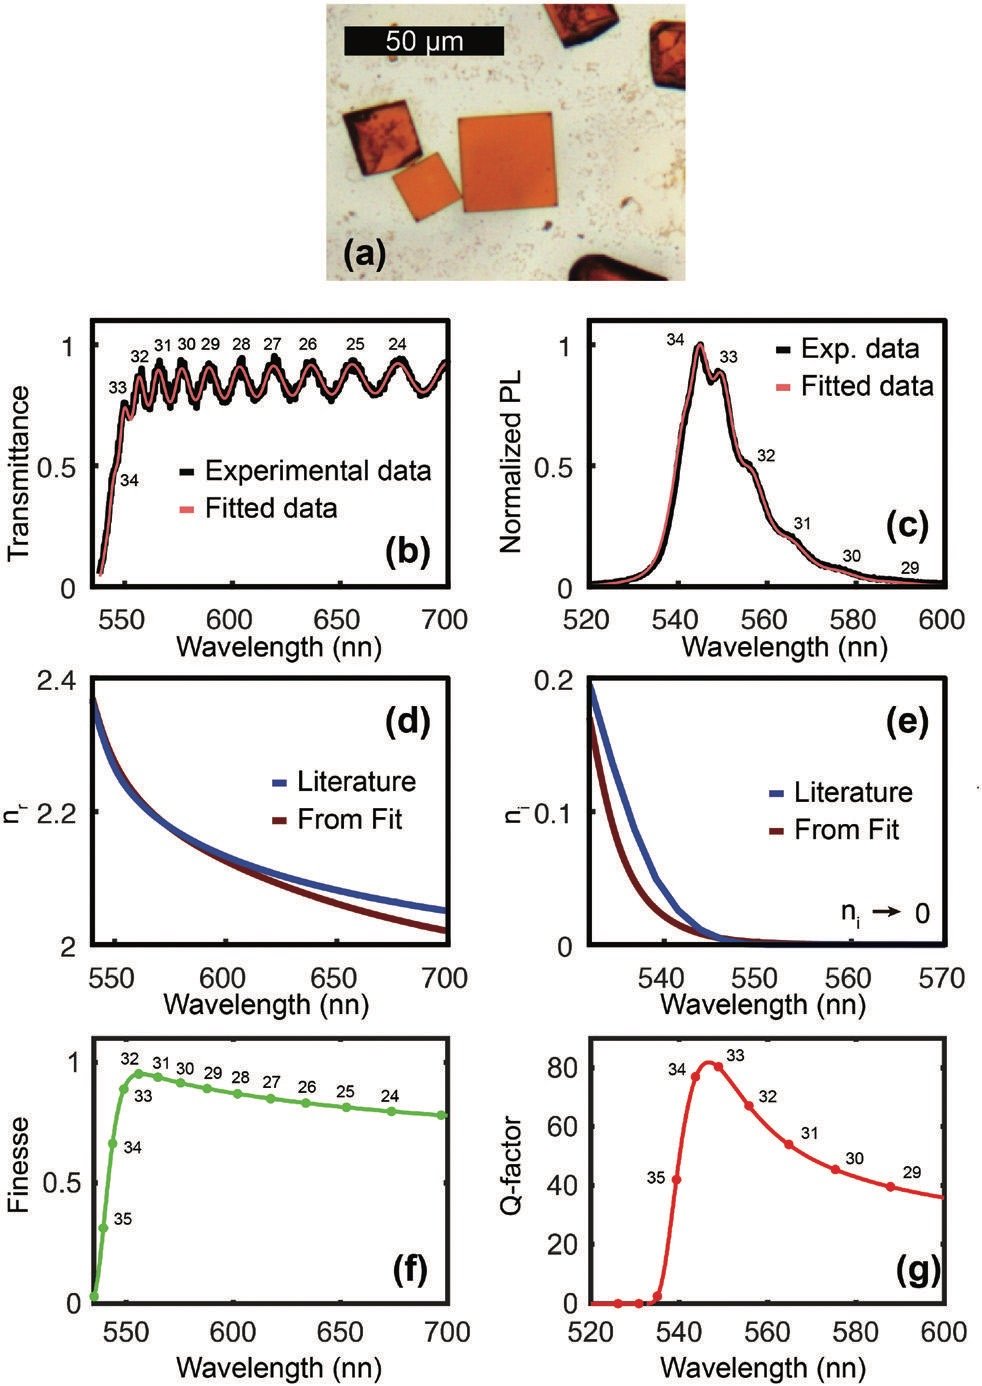
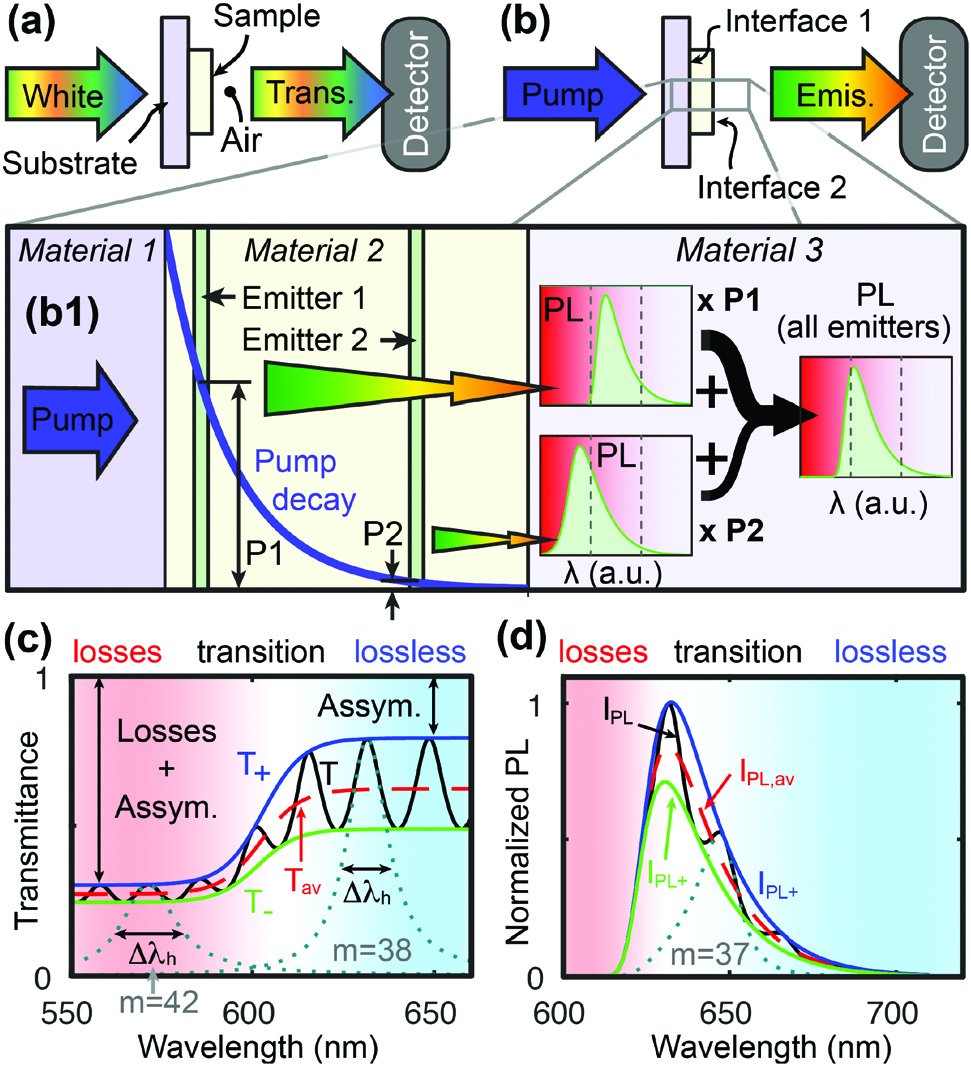
 EmissionPhotoluminescence is not fitted as an isolated material band. Light generated at different depths inside the MAPbBr3 crystal is attenuated by the absorbing perovskite and undergoes repeated reflections before leaving the cavity. Consequently, PL and optical transmission contain the same Fabry–Pérot phase term but have different spectral envelopes. Figure 4 shows that one refractive-index model can reproduce both signals from a 3.96 μm crystal, which is more restrictive than fitting either spectrum alone and helps distinguish cavity modulation from the intrinsic emission profile.
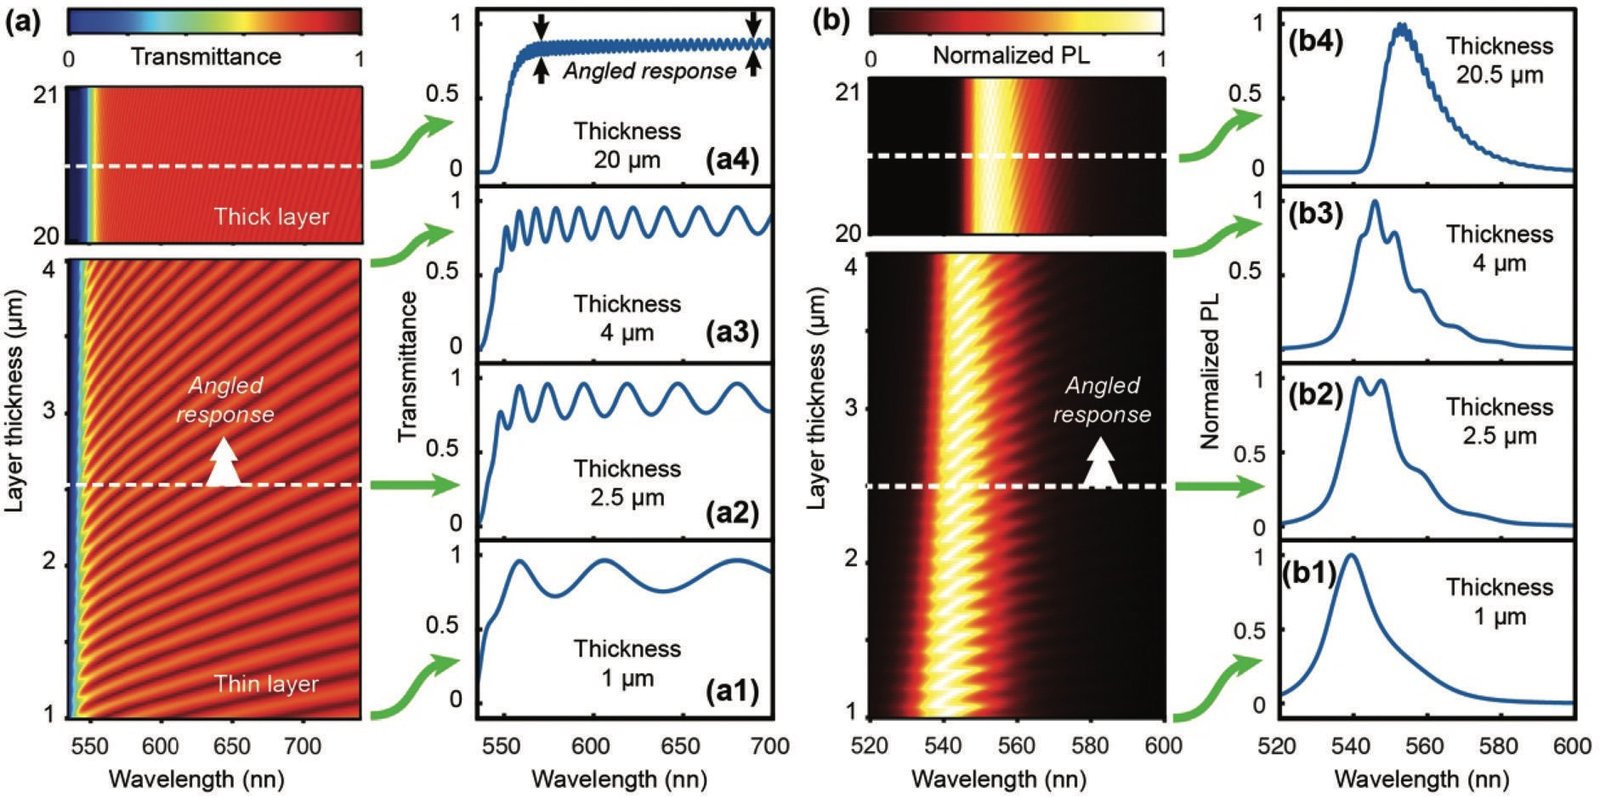
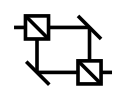 InterferenceParallel crystal faces form a Fabry–Pérot cavity whose fringes depend on wavelength, thickness, absorption and collection angle. Figure 3 maps the calculated transmission and PL as thickness varies, showing why some crystals display clear resonances while others with the same material do not. A finite numerical aperture averages contributions from different wave-vector angles and progressively reduces fringe contrast; the optical-path length also suppresses the blue side of the PL. The analysis therefore treats interference visibility as a coupled geometrical and optical problem rather than a simple quality label.
 MaterialsThe method retrieves both real and imaginary parts of the refractive index from an individual hybrid perovskite microcrystal, avoiding the grain boundaries and orientational averaging of a polycrystalline film. The measured sample in Figure 4 is a planar MAPbBr3 crystal, 3.96 μm thick on glass. Its transmission fixes absorption and phase accumulation, while PL tests how the same constants act on internally generated light. This single-crystal approach exposes resonant behaviour that can disappear when many differently shaped grains contribute to a macroscopic spectrum.
 ResonatorsThe crystal itself is the resonator: no deposited mirrors are required because reflections at the glass–perovskite and perovskite–air interfaces provide optical feedback. Thickness selects the longitudinal mode spacing, and absorption controls how many round trips remain visible. By fitting transmission and luminescence simultaneously, the study determines crystal thickness and complex refractive index without assigning arbitrary peaks. The resulting model is also a design tool: it predicts which thickness and collection aperture will preserve useful cavity contrast in future perovskite microcavities.
 ChemistryMAPbBr3 microcrystals are grown from 1 M methylammonium bromide and 1 M lead bromide in DMF, using N-cyclohexyl-2-pyrrolidone as an additive, and spin-coated onto quartz at 800 rpm. Those chemical and processing choices produce isolated crystals with sufficiently planar, parallel faces for the optical model. The chemistry is therefore relevant not as a generic perovskite label but because solvent coordination, additive-assisted crystallisation and stoichiometry determine the morphology on which the Fabry–Pérot analysis depends.