F. Ramiro-Manzano, website logo

Publication - Journal Article

IEEE Photonics Journal, 11, 6101114 (2017)
DOI: 10.1109/JPHOT.2018.2880281
Link  to the article
Link  to the  PDF 

Hermitian and Non-Hermitian Mode Coupling in a Microdisk Resonator Due to Stochastic Surface Roughness Scattering

S. Biasi, F. Ramiro-Manzano, F. Turri, P-É Larré, M. Ghulinyan, I. Carusotto and L. Pavesi

Abstract

We make use of a phase-sensitive set-up to study the light transmission through a coupled waveguide-microdisk system. We observe a splitting of the transmission resonance leading to an unbalanced doublet of dips. The experimental data are analyzed by using a phasor diagram that correlates the real and the imaginary parts of the complex transmission. In addition, detailed features are evidenced by a complex inverse representation of the data that maps ideal resonances into straight lines and split resonances into complicated curves. Modeling with finite element method simulations suggests that the splitting and the unbalance is caused by an induced chirality in the propagation of the optical fields in the microdisk due to the interplay between the stochastic roughness and the intermodal dissipative coupling, which yield an asymmetric behavior. An analytical model based on the temporal coupled mode theory shows that both a reactive and a dissipative coupling of the counter-propagating modes by the surface roughness of the ring resonator are required to quantitatively reproduce the experimental observations and the numerical simulations.

Figures

Intensity and phase, microresonator, surface scattering, real vs imaginary part
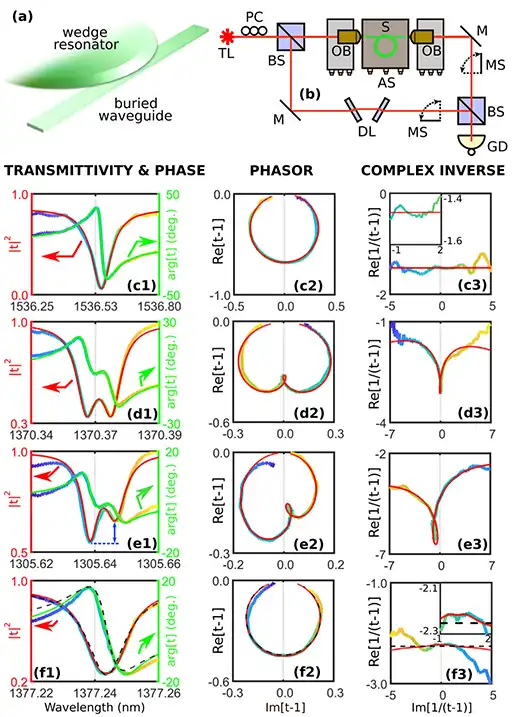
Fig. 1. (a) Sketch of the ring-shaped wedge microresonator device vertically coupled to the bus wave- guide. (b) Sketch of the experimental set-up: TL:=Tunable Laser, PC:= Polarization Controller, BS:= Beam Splitter, OB:= Objective, S:= Sample, AS:= Alignment Stage, M:= Mirror, S:= Movable Shutter, DL:= Delay Line and GD:= Germanium Detector. (c) Experimental spectra of the transmitted intensity and phase for a single-mode microresonator with a negligible surface roughness [27]. (d–f) Experi- mental spectra for the wedge microresonator in different frequency ranges showing a balanced (d), an unbalanced (e), and a hidden (f) doublet. The different columns in (c–f) represent the transmitted intensity and phase as a function of the signal wavelength (c1–f1), the phasor representation (c2–f2) and the inverse complex representation (c3–f3). The colour code (rainbow curves) represents the data as a function of the wavelength (the colour allows to relate the different panels on the same row). The red and green lines display theoretical fits based on the analytical model of Section 4. On panel (e1) we specifically show the intensity unbalance by the arrow and the dashed line.
Simulation 3D, coupling multimode resonator, surface roughness
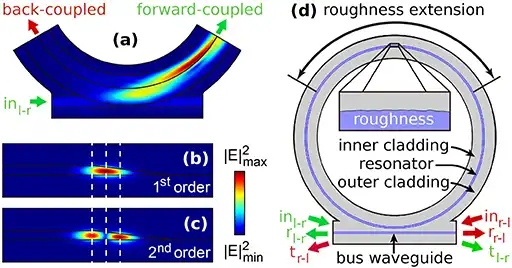
Fig. 2. (a) 3D simulation of the light intensity in the vertical coupling region between the bus-waveguide and the wedge resonator. The field intensity inside the wedge portion reveals a beating pattern between the different radial modes of the wedge resonator [32], [33] that are excited by the forward coupling. The amount of back-scattered light is instead almost negligible. (b)–(c) Field profile of the 1st and 2nd radial modes of the wedge resonator. (d) 2D model of the bus-waveguide-resonator system. The arrows labelled by in, r and t represents the inserted, reflected and transmitted signals, respectively. The indices l-r and r-l refer to the two situations where the input signal light is inserted on the left and propagates from left-to-right (l-r, green arrows) or is inserted on the right and propagates from right-to-left (r-l, red arrows).
Intensity and phase, microresonator, surface scattering, real vs imaginary part
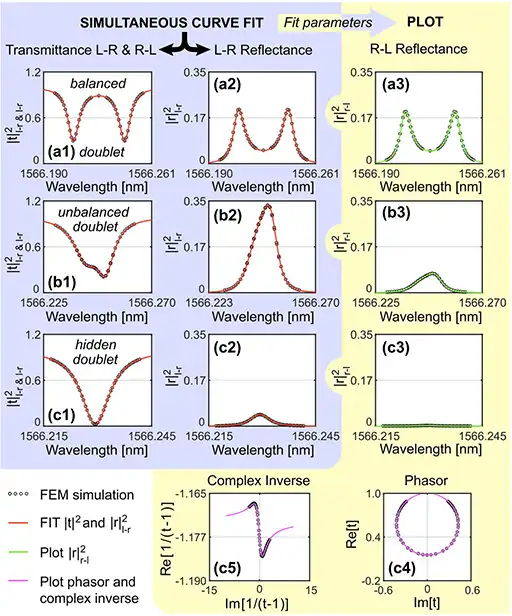
Fig. 4. Transmission (a1–c1), l-r (a2–c2) and r-l (a3–c3) reflection for different realizations of the disorder which yield a balanced doublet (1), an unbalanced doublet (2) and a hidden doublet (3). The black circles are the simulation values while the red line is the fit with the theoretical model of Section 4. For each case, the green curves are obtained by plotting the Eq. 8 for the r-l excitation using the parameters fitted from the l-r ones. While almost invisible in the transmission, the hidden doublet of panel (c1) can be revealed in the complex inverse (c5) of the phasor diagram (c4).
Normalised histograms of the peak unbalance and of the mode splitting, numerical simulations, FEM, microdisk resonator, surface scattering
Panels (a–c): Normalised histograms of the peak unbalance (a1–c1) and of the mode splitting (a2–c2) in different cases: when the resonator (a) or the waveguide (b) are changed from single- to multi-mode (black dashed and coloured solid lines, respectively), and when the Q-factor of the single- mode resonator is halved (black dashed line Q = 2 × 10⁵, green solid line Q = 1 × 10⁵) (c). Panel (d): Simulation of a non-symmetrical scatterer device inside a single-mode waveguide for light incident from (d1) the left (l-r) or (d2) from the right (r-l). Both cases show the same transmission (T = 84.48 %) but different reflections (R l−r = 6.7 × 10⁻² %, R r −l = 0.674 %).
Fig. 5. (a), (b) Sketch of the fields in the the l-r (a panel) and the r-l (b panel) excitation configurations. The different symbols are deinfed in the text.

License/Copyright

Open access article
Fernando Ramiro Manzano, PhD 
Email:
ferraman(at)fis.upv.es
Substitute (at) with @
Phone:
(+34) 96 387 9841
Address:
CTF-ITQ, UPV, Edificio 8B, Avda. Los Naranjos SN, 46360 - Valencia, Spain
This website has been created using Wordpress and the Oxygen builder. To achieve parallax effects, the Vanilla Javascript Parallax Library 'Rellax' (Dixon & Moe) was utilized. Most of the graphical content, such as icons and images, has been created specifically for this website, with the exception of the link favicons and journal copyright material, which have been used with permission from their respective publishers. If there are any questions ir problems regarding permissions, please do not hesitate to contact me.

Thank you for visiting my Website.
Fernando.
LOGO Nanomaterials for optoelectronics, photonics and energy, ITQ, CSIC, UPV, Severo Ochoa