F. Ramiro-Manzano, website logo

Publication - Journal Article

Advanced Optical Materials 2300135 (2023)
DOI: doi.org/10.1002/adom.202300135
Link  to the journal
Link to the manuscript
Link to the supporting information

Supporting Information: Silicon Microspheres for Super-Planckian Light Sources in the Mid Infrared

R. Fenollosa, F. Ramiro-Manzano, M. Garín, and F. Meseguer

Abstract

Supporting information with additional figures and explanations.


Figures

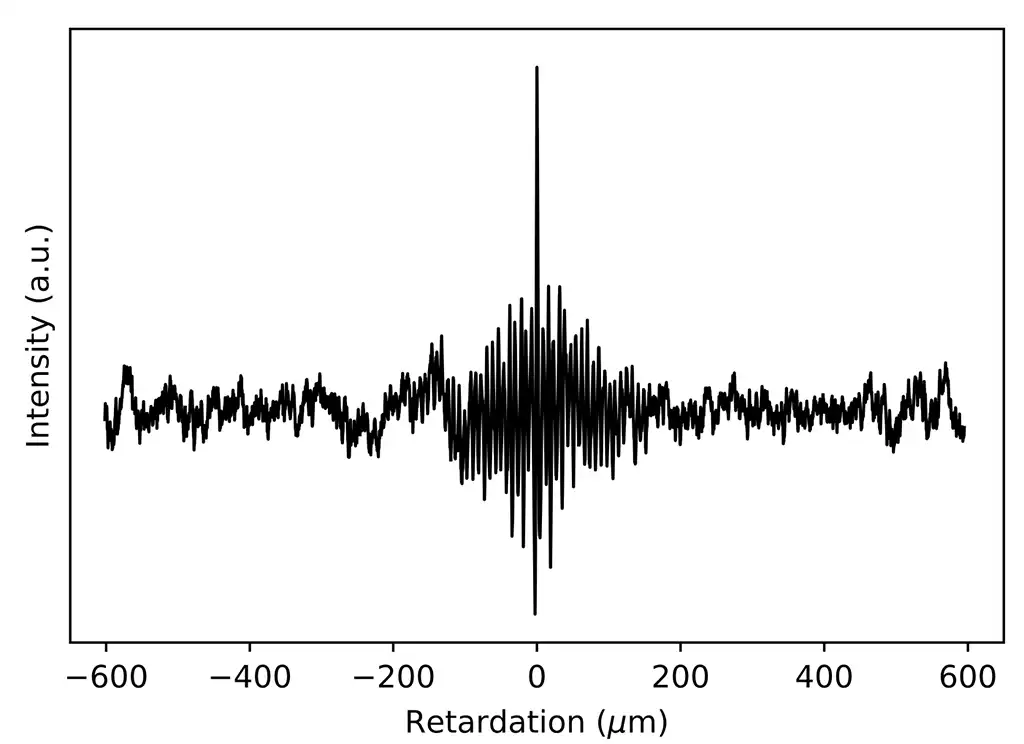
Home Made or bespoke interferogram of a fourier transform based detector for MidIR emission
Figure S1. Home Made or bespoke interferogram of a fourier transform based detector for MidIR emission
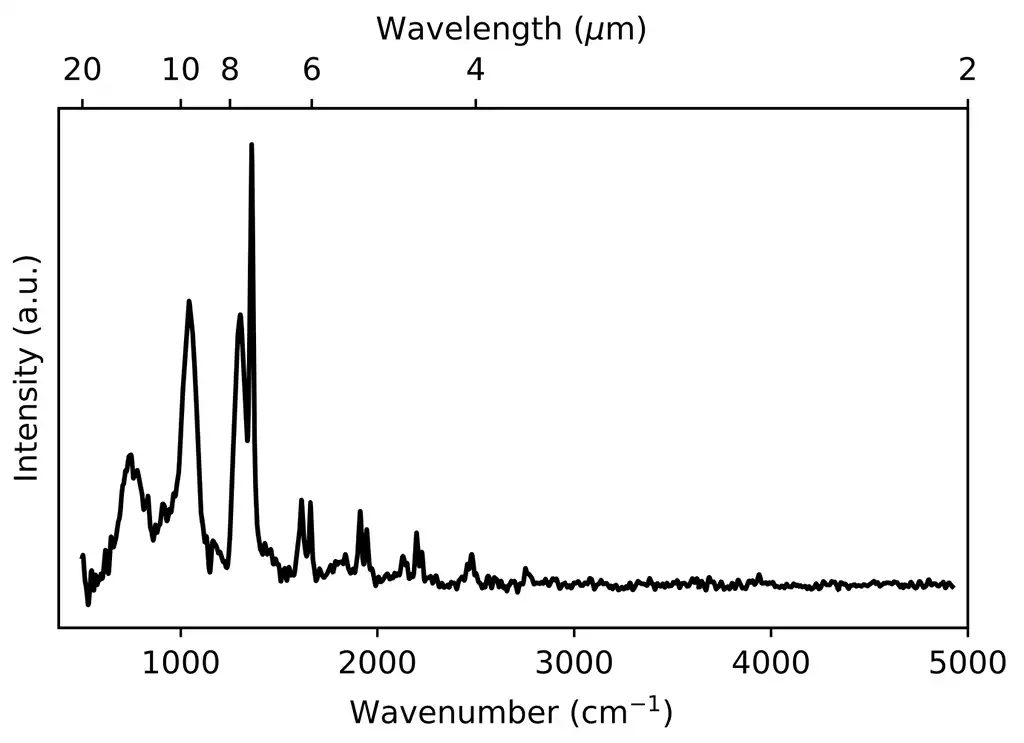
Thermal emission spectrum of microsphere resonator (f = 2080 nm, T = 660o C) as obtained from the Fourier transform of the interferogram of Figure S1 after performing Gaussian apodization.[1] The spectrum is not corrected by the sensitivity of the system.
Figure S2. Thermal emission spectrum of M1 (f = 2080 nm, T = 660 oC) as obtained from the Fourier transform of the interferogram of Figure S1 after performing Gaussian apodization.[1] The spectrum is not corrected by the sensitivity of the system.
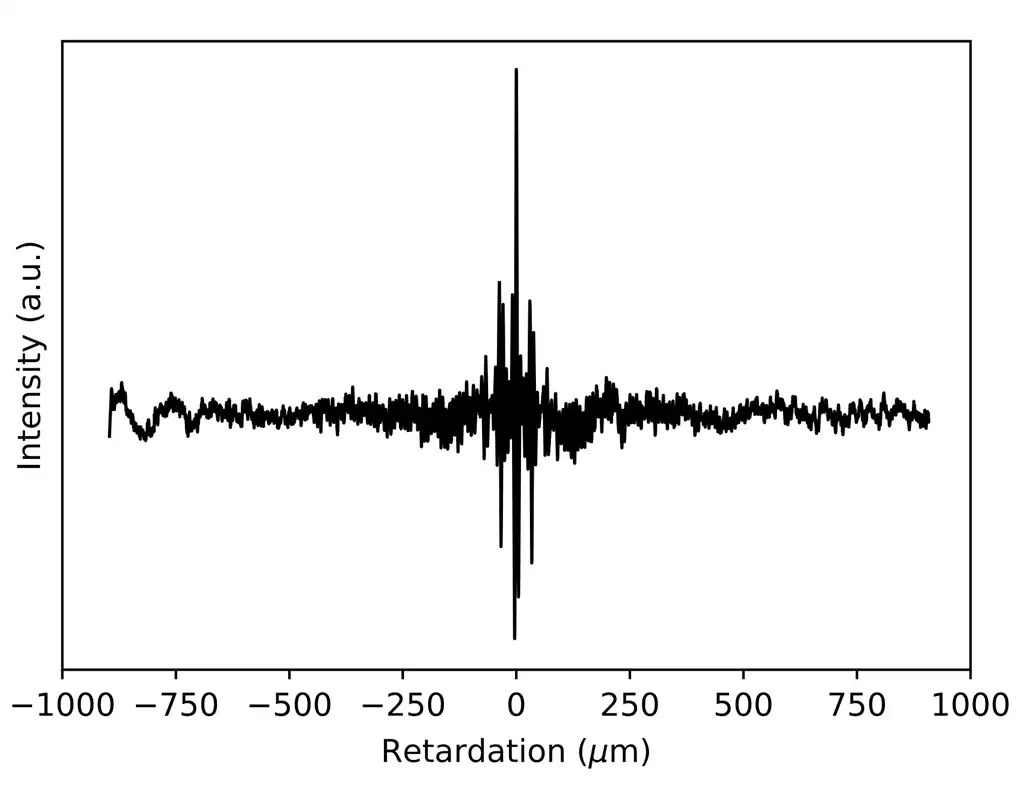
Interferogram corresponding to Microsphere resonator. Thermal emission.
Figure S3. Interferogram corresponding to M2 (f = 3730 nm, T = 560 oC).
Thermal emission spectrum of microsphere resonator (f = 3730 nm, T = 560 oC) as obtained from the Fourier transform of an interferogram after performing Gaussian apodization. The spectrum is not corrected by the sensitivity of the system.
Figure S4. Thermal emission spectrum of M2 (f = 3730 nm, T = 560 oC) as obtained from the Fourier transform of the interferogram of Figure S3 after performing Gaussian apodization.[1] The spectrum is not corrected by the sensitivity of the system.
Sensitivity curve of the measuring a set up of thermal emission. It was obtained by dividing the measured thermal emission spectrum of a bulk carbon body at 300 oC by the theoretical spectrum of a black body at that temperature.
Figure S5. Sensitivity curve of the measuring set up. It was obtained by dividing the measured thermal emission spectrum of a bulk carbon body at 300 oC by the theoretical spectrum of a black body at that temperature.
Internal electric field intensity distributions in the resonant plane of the modes involved in the thermal emission of silicon microspheres
Figure S6. Internal electric field intensity distributions in the resonant plane of the modes involved in the thermal emission of silicon microspheres M1 and M2 of figure 3.

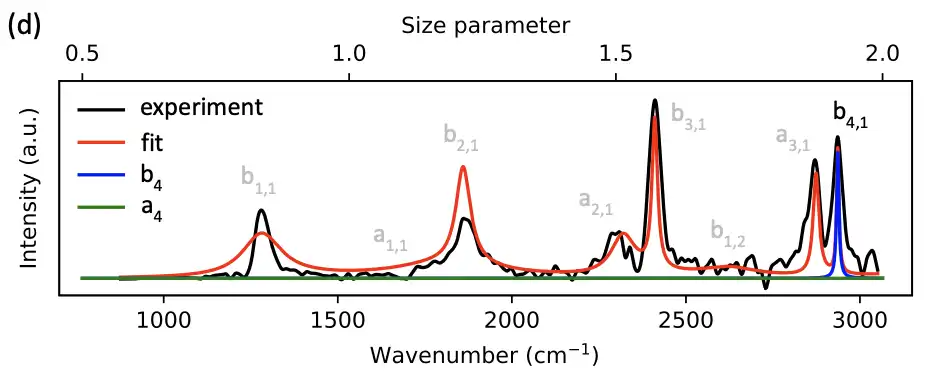
Experimental emission spectra for M1 (black curve), theoretical fitted spectra considering all the multipoles of the Mie series (red curve) and theoretical spectra considering single multipolar bn (blue curve) and an (green curve) terms of the thermanl emission of a Silicon Microsphere
Fig S7 (portion) Experimental emission spectra for M1 (black curve), theoretical fitted spectra considering all the multipoles of the Mie series (red curve) and theoretical spectra considering single multipolar bn (blue curve) and an (green curve) terms of the thermanl emission of a Silicon Microsphere

License/Copyright

Open Access article, reproduced from Ref. Advanced Optical Materials 2300135 (2023)  with permission from Wiley
Fernando Ramiro Manzano, PhD 
Email:
ferraman(at)fis.upv.es
Substitute (at) with @
Phone:
(+34) 96 387 9841
Address:
CTF-ITQ, UPV, Edificio 8B, Avda. Los Naranjos SN, 46360 - Valencia, Spain
This website has been created using Wordpress and the Oxygen builder. To achieve parallax effects, the Vanilla Javascript Parallax Library 'Rellax' (Dixon & Moe) was utilized. Most of the graphical content, such as icons and images, has been created specifically for this website, with the exception of the link favicons and journal copyright material, which have been used with permission from their respective publishers. If there are any questions ir problems regarding permissions, please do not hesitate to contact me.

Thank you for visiting my Website.
Fernando.
LOGO Nanomaterials for optoelectronics, photonics and energy, ITQ, CSIC, UPV, Severo Ochoa